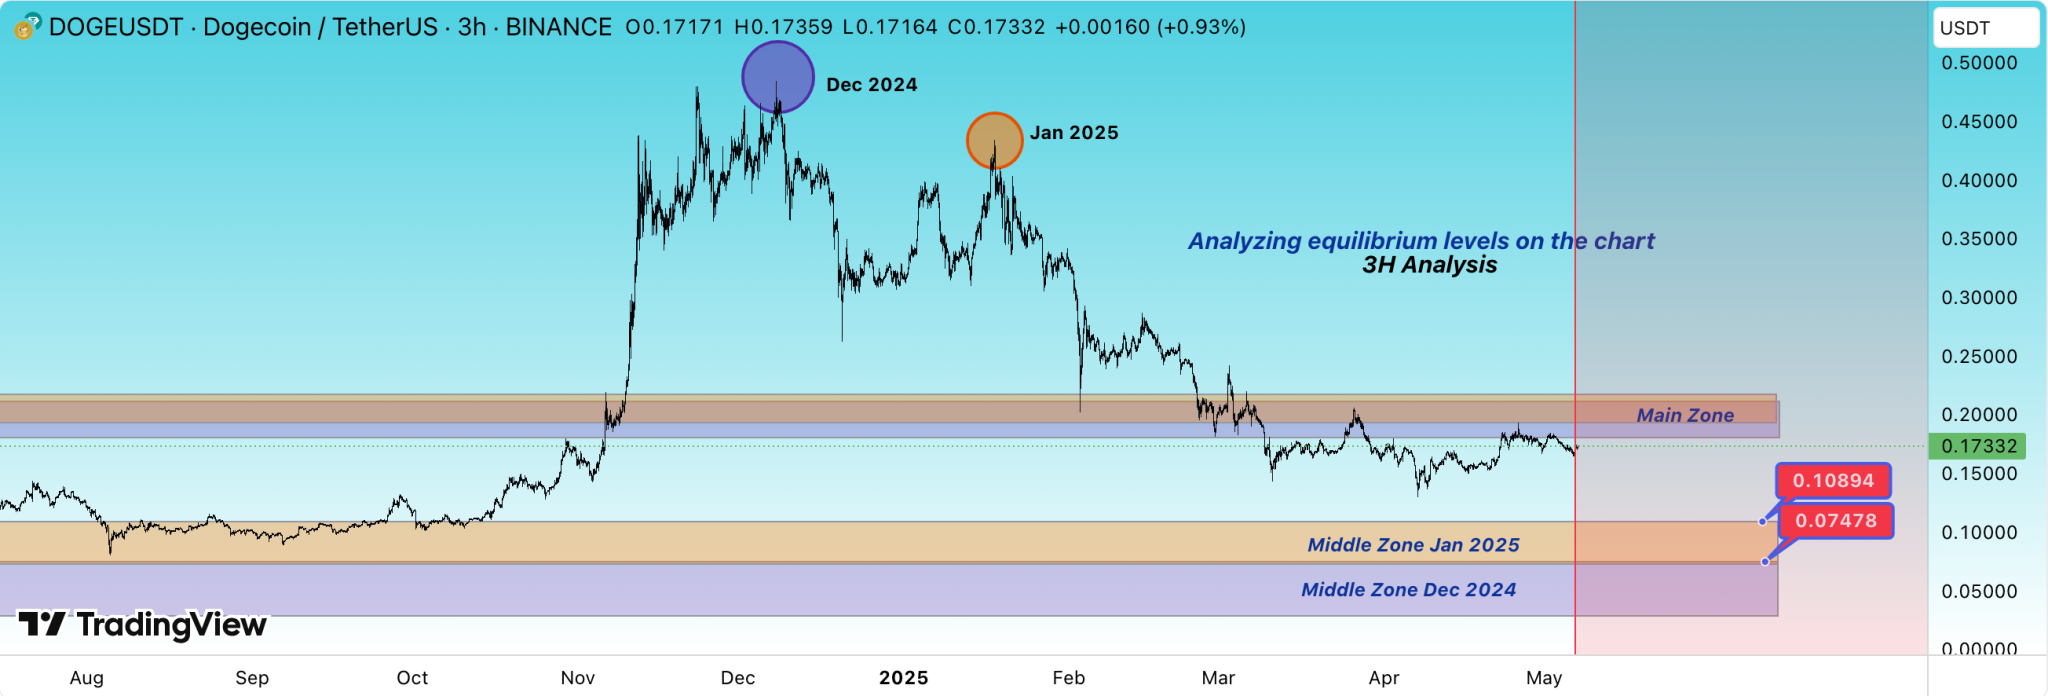
TradingView analyst Farid Saremi sees medium-term weakness in Dogecoin and does not anticipate any significant growth soon.Dogecoin's recent price action reflects a shift in sentiment, as the asset has fallen from early May highs. After briefly touching levels above $0.18 at the start of the month, the coin reversed course, dipping below the $0.175 support line by May 3.The decline continued into May 6, with the price reaching a local low just above $0.165. As of press time, Dogecoin is trading near $0.1734, showing a minor 3% recovery over the past 24 hours.However, this rebound has done little to resolve the growing uncertainty around its broader trend. As analysts assess the coins macro positioning, conflicting interpretations have emerged.Macro Resistance Anchors Farid Saremi, a TradingView analyst, has focused on a 3-hour DOGE/USDT chart to identify macro-level patterns. His assessment centers on equilibrium zones anchored to two significant resistance pointsDecember 2024 and January 2025. In December, Dogecoin reached just under $0.50, while in January it peaked lower, near $0.43.Dogecoin Price Prediction Dogecoin Price ChartAfter these highs, the price declined to hover below a consolidation band between $0.18 and $0.21. This range now represents the main equilibrium zone. Notably, the price has slipped beneath this area, signaling diminished strength.The chart interprets the drop below this zone as a breakdown, implying that buyers failed to maintain the balance. According to Saremi, Dogecoin is not ready for major growth in the medium term, and price action is expected to gravitate toward the middle zone.Structural Supports at Lower Levels for DogecoinFollowing the loss of the main equilibrium zone, Saremi identifies two additional levels to watch. The first is located at $0.10894, which corresponds to price consolidation from January 2025. This area acts as intermediate support and may become the new balance zone if the price continues downward. Further below, a deeper structural level near $0.07478 represents the final downside target. This level is based on historical price clustering from the OctoberNovember 2024 period.Saremi emphasizes that external factors, such as actions by large holders or market news, may affect timing, but these variables will not invalidate the projected levels. He states, "We may be delayed in reaching the target, but the targets will be touched."Contrasting Bullish SignalsIn contrast, Trader Tardigrade analyzes Dogecoins performance against the total crypto market using a 3-day DOGE/Total chart. https://twitter.com/TATrader_Alan/status/1920041933277479311His analysis identifies a recurring pattern of falling wedges. The first wedge formed during mid-2024 and resolved in a sharp breakout, driving Dogecoin from around $0.10 to $0.46a 300% surge. After the rally, the asset entered a correction phase, forming another wedge from February to May 2025.This second wedge mirrors the structure of the previous one, with narrowing price ranges and compressing volume. The analyst highlights this tightening pattern as a sign of accumulation and potential breakout. He notes the technical similarity between the two wedges, implying that the current structure may precede another major move. If the 300% rise were to repeat, Dogecoin could reach $0.6936 based on its current value.
WE AND OUR PARTNERS USE COOKIES ON THIS SITE TO IMPROVE OUR SERVICE, PERFORM ANALYTICS, PERSONALIZE ADVERTISING, MEASURE ADVERTISING PERFORMANCE, AND REMEMBER WEBSITE PREFERENCES.
By using this website, you automatically accept that we use cookies.
To learn more about use of cookies see our Privacy Policy. Learn More.