ZkSyncs Gemholic project suspected $3.5M rug pull
Community members are currently trying to trace the Gemholic contract creators address, which is supposedly funded by Binance.
Loading
Welcome at World Crypto Global. This portal is packed with useful content and resources to built out your own crypto skills. WorldCrypto is a site member of Gabriel Vega Network.

Community members are currently trying to trace the Gemholic contract creators address, which is supposedly funded by Binance.
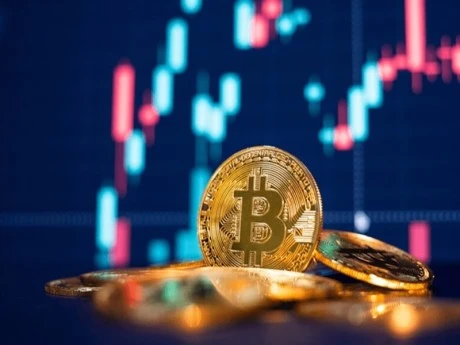
In the last week, the price of Bitcoin took a significant nosedive, recording a 7% loss to trade as low as $59,478. According to data from CoinMarketCap, Bitcoin attempted a rebound following this dip but has since been stuck in consolidation between $60,100 – $62,300. Commenting on this development, John Bollinger, inventor of the Bollinger Bands, a popular technical momentum indicator, has provided potential insights into Bitcoins next movement as investors continue to await the much-expected crypto bull run. Related Reading: Market Tremors: $10 Billion in Bitcoin Dumped in May Alone, What Does This Signal? Bitcoin To Remain In Consolidation, Bollinger Says In an X post on June 28, Bollinger predicted the price of Bitcoin will maintain its current range-bound movement. The prominent analyst made this projection based on the absence of a price bound following a two-bar reversal at the lower Bollinger Band. For context, the Bollinger Bands consist of three lines (bands) namely a Middle Band which is typically a 20-day moving average of the assets price, and an upper and lower band which represent the SMA plus and minus two standard deviations of the price respectively. The Bollinger Bands are primarily used for trend identification and for indicating potential breakouts and breakdowns. Notably in trading, a two-bar reversal is a candlestick pattern showing a potential change in price direction. When this pattern occurs at the lower Bollinger Band, it often suggests that the asset might experience a bounce or a reversal to the upside due to being oversold. However, in the current case of Bitcoin in which there is no price gain following this development, it can indicate continued weakness or price indecision which may cause BTC to remain in consolidation. Generally, such sideways price movements are driven by bearish or uncertain sentiments leading to a lack of buying pressure from investors even at lower prices. In addition, this absence of price bounce also indicates that the current lower Bollinger Band represents a weak support level increasing the risk of a price breakdown. Related Reading: Is The Bitcoin Bottom In? Crypto Expert Predicts Bullish Price Reversal BTC Price Overview At the time of writing, the price of Bitcoin continues to trade at $60,629 with a 1.31% decline in the last day. However, the assets daily trading volume is up by 15.95% and is currently valued at $24.8 billion. Notably, Bitcoin lost 11.69% of its value in June as its price dipped below $60,000. However, despite this decline, investors remain resilient in their expectations of a price rally to kick-start the crypto bull season. Notably, a crypto whale recently bought 20,200 BTC at $1.23 billion, showing much confidence in the tokens ability to stage a price rebound and embark on a bullish run. BTC trading at $60,750 on the 4-hour chart | Source: BTCUSDT chart on Tradingview.com Featured image from Shutterstock , chart from Tradingview
The Entry How to Pulse stacking project Audit Report was published first on CoinFabrik.
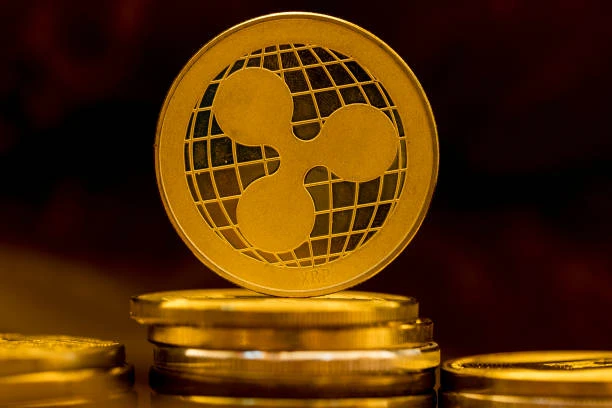
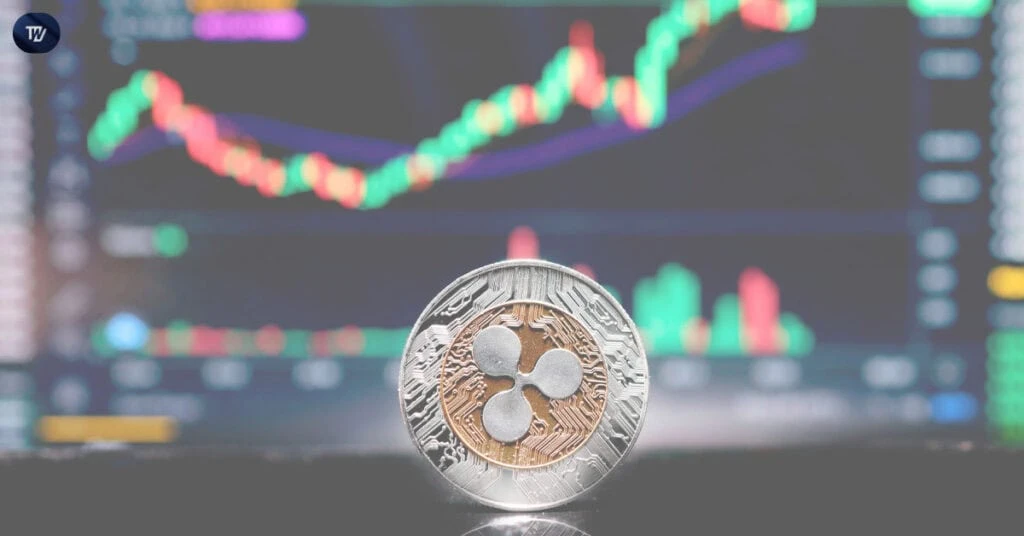
Crypto analyst ArShevelev has raised the possibility of history repeating itself for the XRP price. If so, the analyst indicated that the altcoin could witness a 2017-like rally, which would send its price to double digits. XRP Price To Reach $10 If History Repeats Itself In a TradingView post, ArShevelev predicted that the XRP price could reach as high as $10 if history repeats itself. He remarked that the current XRP chart screams déjà vu with the altcoins price action mirroring the 2014 to 2018 cycle. The analyst noted that XRP broke out from its 2014 all-time high (ATH) in 2017, leading to a massive rally. Related Reading: XRP Price Is Eyeing Another Breakout To $4: Analyst Says Watch This Level A similar setup is playing out for the XRP price, but with a twist. ArShevelev stated that XRP is struggling to break through the 2018 ATH resistance zone around $3.31, which he claimed reminded him of the breakout consolidation phase in 2017. The analyst added that this consolidation has historically led to a breakout, and the chart hints at a potential repeat. He affirmed that the price could witness a parabolic move if it breaks out soon, potentially targeting much higher levels. However, the analyst warned that the current resistance is a tough hurdle, and XRP might pull back to lower supports if it fails. ArShevelev also provided key levels to watch out for. He highlighted $3.31 as the major resistance while $1.643 is the major support. The breakdown risk is $0.650, meaning the XRP price could still drop to last years lows. The analyst admitted that he isnt fully convinced about the setup but considers it intriguing. He added that this could be XRPs moment to shine. The Altcoin Needs To Break Out Of Its Current Range Crypto analyst Ali Martinez recently highlighted the need for the XRP price to break out of its current range. In an X post, he stated that the key levels to watch are $2 and $2.26. The analyst added that a decisive close outside this range could set the tone for the next major trend. Related Reading: XRP Price Breaks Above Magic Line With Bullish Continuation Toward $3 Martinez looks to be favoring a downtrend for the altcoin’s price in the short term. In another post, he stated that XRP could be due for a retracement, with the TD Sequential flashing a sell signal on the 3-day chart. Crypto analyst CasiTrades also didnt rule out a possible correction for the XRP price. However, she claimed the altcoin could bounce off key supports to new highs, noting that momentum was building. She revealed that the RSI is showing signs of selling exhaustion on the lower timeframes, and the price action is beginning to compress. This often signals a bigger move is on the horizon. At the time of writing, the XRP price is trading at around $2.17, up almost 2% in the last 24 hours, according to data from CoinMarketCap. Featured image from Getty Images, chart from Tradingview.com
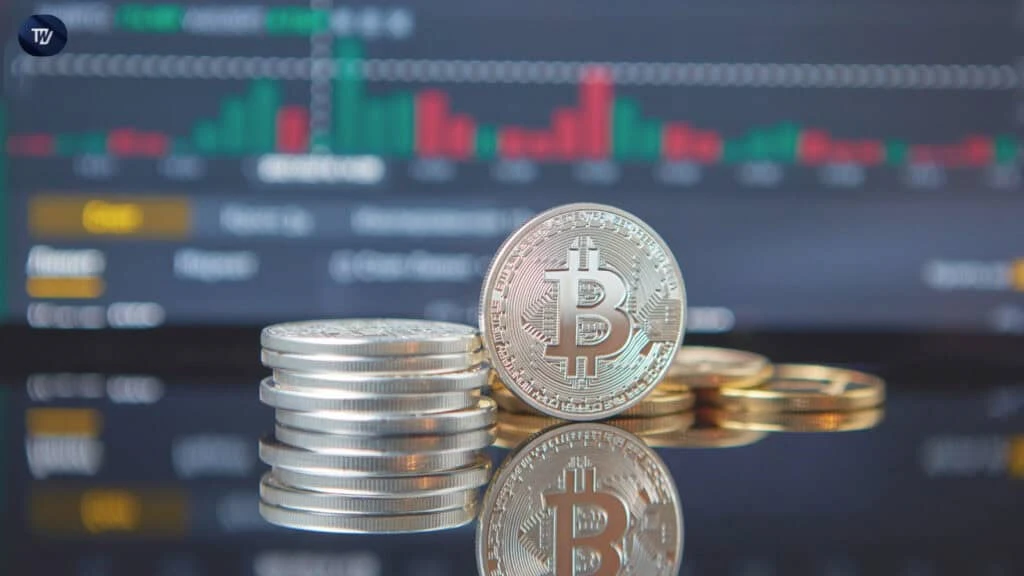
83.93% of Bitcoin holders are still in profit, and the presence of a strong market structure is indicating a continued growth
Following the Bitcoin halving in April, analysts and investors remain on the edge of their seats in anticipation of a major price breakout by the maiden cryptocurrency. While Bitcoin did rise to $71,443 in the past week, the token soon suffered a retracement falling as low as $66,936. Interestingly, renowned analyst with X handle Rekt Capital has provided an interesting insight into this recent price movement and also predicted the period BTC may finally embark on a highly-anticipated bullish run. Related Reading: Bitcoin Price Enters Make Or Break Zone: Analyst Reveals Important Levels To Watch Bitcoin To Consolidate For A Long Time – Analyst In a series of X posts on May 24, Rekt Capital noted that after the halving event, Bitcoin entered the post-halving danger zone, a period during which the token lost about 11% of its value. Following this phase, the most-priced cryptocurrency attempted a breakout which encountered a rejection at the range high zone ($71,500) of the macro re-accumulation range. #BTC Since the Bitcoin Post-Halving “Danger Zone” ended, Bitcoin broke out to $71500 However, ~$71500 is where the Range High resistance of the Macro Re-Accumulation Range is and this is where Bitcoin rejected from The consolidation continues and history suggest it will https://t.co/YjZzimnFj9 pic.twitter.com/JGji7ZYOSe Rekt Capital (@rektcapital) May 24, 2024 For context, this range represents a long-term consolidation phase where Bitcoin accumulates value before potentially breaking out to new highs. Rekt Capital states that Bitcoin being rejected at the $71,500 price region is quite expected as BTC never breaks through the high side of the re-accumulation range on the first attempt after halving. Based on historical price data, Rekt Capital anticipates Bitcoin will now remain in consolidation for multiple weeks until 160 days after halving before finally experiencing its major price breakout in September. During this time, the premier cryptocurrency is expected to trade between $60,000 and $70,000 which will result in variations in the portfolio valuation for long-term investors. However, this price consolidation can also present opportunities for these investors to buy Bitcoin near the lower boundary of the range thus consistently accumulating at relatively stable prices. Meanwhile, short-term traders such as swing traders or day traders are likely to capitalize on these expected price fluctuations between an established support and resistance which could result in significant profit. Related Reading: Bitcoin Bulls Gain Breathing Room As Long-Term Holder Activity Eases Glassnode BTC Price Overview Bitcoin is currently trading at $68,720, marking a 2.27% gain in the last day, a 2.31% gain over the past week, and a 6.90% increase in the last month. Despite these gains, its daily trading volume has dropped by 45.68%, now valued at $24 billion. BTC is also 6.94% below its all-time high of $73,750. The recent price rise amid declining trading volume suggests cautious investor sentiment, with Bitcoin consolidating within a narrow range as the crypto market leader once again approaches significant resistance levels. Featured image from The Economic Times, chart from Tradingview
XRP price forecasts have taken a dramatic turn as bold predictions surface, suggesting that the cryptocurrency could be on the verge of a parabolic 64,000% rally to $1,700. Analysts backing this ambitious forecast point to historical price patterns and XRPs current technical structure as the basis for their end-of-the-year predictions. A chart shared by crypto analyst The Real Remi Relief on X (formerly Twitter) shows that XRP is mirroring a technical pattern that preceded its 2017-2018 historical bull run one that saw the third largest cryptocurrency skyrocket by tens of thousands of percent in just a few months. Now that this historical pattern is unfolding, the analyst has confirmed that a breakout is on the horizon for XRP, with projections pointing toward a potential price target as high as $1,700. XRP Price End Of Year Forecast The chart shows two distinct consolidation phases in XRPs price action the first spanning from 2014 to 2017 and the second lasting from 2018 until early 2024. During both periods, the cryptocurrency underwent a long-term compression under a descending resistance line. This compression was followed by a breakout, retest, and vertical price expansion. Related Reading: XRP Moves Into Key Range Against Bitcoin As 3 Major Targets Show Up Notably, this breakout in 2017 led to XRP reaching its historical all-time high of $3.84 a level it hasnt revisited for over six years. Earlier this year, XRP experienced a similar breakout that pushed it above the multi-year downtrend. The current chart shows that the cryptocurrencys retest is holding steady, and this pattern has previously preceded massive rallies during the past bull cycles. As a result, Real Remi Relief argues that history is on the verge of repeating itself. According to his end-of-year forecast for XRP, the cryptocurrency is poised for a staggering 64,000% rally, placing its price at a jaw-dropping $1,700 per token by as early as Q4 2025 or Q1 2026. While the timeline could extend into the following year, the outlook still frames 2025 as a bullish turning point for XRP, with strong potential for the altcoin to close the year in a strong green. Interestingly, the crypto expert has also shared a more conservative target, predicting that XRP could record a still ambitious, but more realistic surge to $1,200 by years end. XRP Could Skyrocket Even Higher By 150,000% While the Real Remi Reliefs $1,700 price projection for XRP is undeniably bold, the analyst goes even further, speculating that the cryptocurrencys total upside potential in this cycle could soar as high as 80,000% and 150,000%. This surge could catapult XRPs current price of $2.4 to an astonishing $1,920 and $3,600, respectively. Related Reading: XRP: Exit Liquidity Pattern Forming Signals Crash To $1 Such gains would not only eclipse XRPs previous all-time high but also represent one of the most dramatic asset revaluations in crypto history. Skepticism remains, of course, particularly amongst commentators under the analysts X post, who view this bold forecast as an almost impossible goal. Featured image from Adobe Stock, chart from Tradingview.com
The Bitcoin halving is widely expected to have a positive impact on the price of the preeminent cryptocurrency, but analysts expect volatile price consolidation in the short term.
Can AITECH coin hit $1? According to the Solidus Ai Tech price prediction, by the end of 2030, the AITECH crypto price is expected to reach a maximum level of $1.1 (+1,500%).
The post Solidus Ai Tech Price Prediction: Is AITECH Coin a Good Investment? first appeared on StealthEX.Toncoin (TON) is showing early signs of consolidation after a notable rally in early May. The cryptocurrency recently touched a high of $3.54 but has since retraced, now trading at around $3.29 as of May 13, 2025. Technical indicators suggest a pause in bullish momentum, raising questions about TONs next move. Toncoin Holds Above Support […]
Over the past three days, Bitcoin has hovered between $103,000 and $104,500, creating a narrow channel after a notable rally that saw it break above $100,000 last week. Technical analysis of the daily candlestick chart shows the formation of a minor impulsive wave from $103,000, which may mark the final end of the recent consolidation and the beginning of a fresh rally towards new highs. Notably, recent price action in the past 12 hours or so has seen the gradual end of the consolidation, and attention is now turning to the next psychological level at $110,000. Analyst Sees Breakout As Signal For Upside Continuation In a post shared on the social media platform X, crypto analyst CrediBULL explained the logic behind his current long trade setup, pointing out that Bitcoin has broken away from its three-day consolidation zone with an early impulse that started at the $103,000 level. His analysis predicted that this movement could be the start of a much larger leg upward, especially if the current price structure holds without falling back into a local demand zone between $101,000 and $102,000. Related Reading: Bitcoin 6-Month Flight Plan To $188,000, Heres The Roadmap According to CrediBULL, the current trade has a clean invalidation level just below the impulse origin, allowing for a tight stop loss. This setup yields a high reward-to-risk ratio exceeding 5:1, with an upside target of $110,660, as illustrated in the chart. If this breakout is genuine, it could be a signal that Bitcoin is preparing for an aggressive push toward new all-time highs. On the other hand, CrediBULL cautioned that if the current move proves to be a deviation and price falls below the impulse origin, focus should shift to the local demand zone around $101,800. The chart supports this with a clearly marked green area labeled local demand. This is the next major support if Bitcoin bulls fail to hold the current price levels. $110,000 Bitcoin Target In Sight With Increasing Market Momentum According to the crypto analyst, his prediction of the next move to $110,000 has at least a 20% chance of playing out. These odds are quite nice, considering the unpredictable nature of the crypto market. Related Reading: Whats Driving The Bitcoin Price Recovery Above $100,000 And Is It Sustainable? Notably, price action in the past 24 hours has seen the leading cryptocurrency break above $105,000 again, peaking at an intraday high of $105,503 before easing slightly. This move strengthens the case that the recent consolidation phase may have concluded, and a successful move above $110,000 before the end of the week is underway. At the time of writing, Bitcoin is trading at $104,428. A successful rally to the $110,660 target would represent a 6% gain from the current price, while downside risk is capped below the $103,000 level. Featured image from Getty Images, chart from Tradingview.com
The XRP price is preparing once again for an explosive move toward the $3. Aiming to break out from its consolidation phase, XRPs price action suggests a massive rally could be right around the corner. The analyst who forecasted this bullish move remains broadly optimistic about XRPs future outlook. However, he has also cautioned that a fakeout and subsequent price breakdown are possible. XRP Price Gets Ready For Moonshot Toward $3 In a 1-hour chart analysis, ArShevelev, a crypto analyst on TradingView, disclosed that the XRP price has been forming a sequence of tight consolidation patterns. The colored triangular formations on the price chart highlight each consolidation pattern formed over the past few weeks. These triangles show that price action has been moving sideways, indicating indecision before a breakout. Related Reading: XRP Price Ready To Reach $8 As Consolidation Breaks Heres The Timeline With XRP set to breakout from its present consolidation pattern, ArShevelev predicts the cryptocurrency could soon surge to the $3 mark, representing a 37% increase from its current market value. As of writing, the XRP price sits around the $2.19 mark after sharply rebounding from a critical support zone near $2.05. The $2.05 support zone is identified as a must-hold level, as a break above would maintain the altcoins present bullish structure. Moving forward, the TradingView chart shows an overarching bullish trend, with price action respecting XRPs rising support line. A fresh consolidation triangle has formed, and if history is any indication, XRP could break upward from this pattern, targeting an initial price level of $2.36. A bold highway to moon arrow on the price chart points to a successful breakout that could push the price toward a higher price level of $2.6 and perhaps even spark a broader rally to $3. In his analysts, ArShevelev highlighted a previous support zone at $2.21, where buyers initially stepped in, noting it as an important holding area for XRP to maintain. Bullish Setup For The Altcoin: Breakout Or Fakeout? While XRPs technical setup and potential breakout from consolidation look promising, ArShevelev has advised caution as the market can be unpredictable. Cryptocurrencies are known for their volatility, and failed breakouts are not uncommon, especially when the price hovers just below resistance for too long. Related Reading: XRP Price Eyes Recovery To $3 As Analyst Reveals How High The Price Would Be In Altcoin Season If XRP fails to break above the $2.29 resistance level convincingly, the analyst projects a sharp breakdown to the $2.21 support zone. Further pullback here could open the doors for an even larger price drop to the important support, some at $2.05. This potential price decline is described as a fakeout, as XRP gives the illusion of embarking on a rally but instead sharply reverses. Thus, while technical indicators favor an upside breakout in the XRP price, the TradingView analyst still questions whether it could lead to a breakout to new highs or ultimately result in a fakeout. Featured image from Medium, chart from Tradingview.com
The Entry Mokens League: Token Audit Report was published first on CoinFabrik.
Solana is showing signs of pre-breakout behavior as it consolidates below an important price threshold. According to a new technical analysis shared by RLinda on the TradingView platform, the $136 level is currently a decisive resistance point, and Solanas current trading behavior suggests that a move above this level could ignite a fresh bullish push even as the global market situation is bearish. Solana Finds Stability After False Breakdown The current structure of Solanas price chart reflects a notable recovery after what the analyst described as a false breakdown below the range support zone. This false breakdown refers to the price crash between the last week of March and the first week of April, during which the Solana price briefly broke below $100. Notably, this break below $100 came as an extension of a decline run after a break below a key support range between $115 and $108. Related Reading: Solana Price To Drop To Double Digits? Major Levels To Watch For Entries After briefly dipping below key support, Solana quickly rebounded, and the market responded with renewed buying pressure that sent its price back above $130. However, this push is starting to slow down, with resistance at $136 and a consolidation phase between $130 and $136. This consolidation range is proving to be an important zone for Solana’s bullish potential going forward, according to RLinda. This behavior is further reinforced by liquidity dynamics. The analyst highlights a liquidity imbalance created by the recent false breakdown, which could favor upward price movement as Solana bulls seek to reclaim the upper zones above $136. A sustained move above $136 could serve as the initial trigger for a breakout, potentially shifting short-term market sentiment in Solanas favor. If this scenario unfolds, the move would provide technical confirmation of growing strength among buyers. This bullish potential is notable, even as RLinda noted that the global market situation is bearish. Breakout Above $136 Could Unlock Higher Price Targets For Solana Speaking of the bearish global market situation, RLindas analysis categorizes the local Solana setup as neutral, indicating that the price is in a range rather than exhibiting a definitive trend. Crypto market dynamics also lend weight to the bullish outlook for Solana. Bitcoin, the dominant force in the crypto market, is itself undergoing consolidation and has been highly correlated with Solanas movements in recent weeks. Should Solana manage to close and consolidate above $136, the chart opens up to a sequence of local targets, with the $140, $147, and $152 levels becoming the following areas of interest. Related Reading: Ethereum, Solana And Cardano Trend After Crypto Crash Heres What You Should Know At the time of writing, Solana is trading at $ 134.80, up 0.5% in the past 24 hours and 15.6% in the past seven days. Even if the outlook is bullish, minor corrections may still occur as this process unfolds. In such a scenario, the Fibonacci 0.5 retracement, located around $125.28, will provide a cushion for price corrections. As such, any short-term dip from the current price level may be met with strong support and accumulation at the Fib retracement. Other support levels are at $129, $123, and $111. Featured image from Adobe Stock, chart from Tradingview.com
Ripples native token, XRP, is showing signs of resilience despite a turbulent week in the cryptocurrency market. As of now, marking a 3.39% decline over the last 24 hours. However, a 10% increase in XRP trading volume signals growing investor interest, suggesting that bullish momentum could soon return. Global Tensions Weigh on Crypto Market The […]
PEPE is on the positive momentum after several weeks of market volatility and downtrend pressure caused by a big sell-off in the crypto market and many other factors that caused alarm among crypto investors. As of April 2025, the overall market has moved from bearish to bullish due to Bitcoins recent surge. PEPE is one […]
The world is moving towards a more decentralized future, and developers need the right tools to build decentralized applications. In this article, we'll introduce you to the best Web3 open-source tools for 2023.
Solana has faced intense selling pressure and price swings, with the asset losing over 57% of its value since January 13. Bulls have struggled to regain momentum, and market sentiment suggests that the crypto market is not in a healthy condition for a strong recovery. As uncertainty continues, investors remain cautious, watching for signals of a potential trend shift. Related Reading: Ethereum Holds Key Support Amid Volatility Can Bulls Break $2.3K To Regain Momentum? However, despite the bearish outlook, some analysts believe that this correction could be nearing its end. Many are now looking for key technical confirmations that could indicate a reversal or breakout in the near future. A top crypto analyst, Ali Martinez, shared a technical analysis on X, revealing that Solana remains in consolidation within a wide range pattern. This type of formation often suggests increasing volatility before a potential breakout to higher prices. If SOL follows the historical behavior of this pattern, it could be positioning for a significant move upward once market conditions stabilize. With Solana hovering near crucial price levels, the coming days will be key in determining whether bulls can reclaim control or if further downside awaits. Traders are now watching for a decisive breakout or another leg down before making their next move. Solana Struggles Around Crucial Demand Solana is struggling to hold the $140 support level after failing to reclaim higher price levels, keeping sentiment bearish as price action continues in a downtrend. Analysts remain cautious, warning that SOL could see further declines unless bulls regain control and establish stronger momentum. The past few weeks have been marked by unpredictable events, adding to the markets uncertainty. The ongoing trade war developments between the United States, Mexico, Canada, and China have put additional pressure on financial markets, including crypto assets like Solana. Meanwhile, President Trumps executive order to establish a Strategic Bitcoin Reserve had an underwhelming effect on the market, failing to generate the bullish reaction many investors had hoped for. Despite these challenges, some technical indicators suggest that Solana may be gearing up for a significant move. Martinez’s analysis highlights that SOL remains in consolidation within a right-angled ascending broadening pattern. Historically, this formation has led to high volatility and a breakout in either direction, hinting that a major price move could be coming soon. If Solana breaks below $140, it could trigger a deeper correction, further reinforcing the bearish trend. However, if bulls manage to push SOL above key resistance levels, it could reverse the downtrend and set the stage for a strong recovery rally. Related Reading: Litecoin Holds Bullish Outlook As the MVRV Ratio Signals Strength Analyst For now, traders are closely monitoring SOLs price action, waiting for a decisive move that could determine its next major trend. The coming days will be crucial in assessing whether Solana can stabilize and rebound or face further downside pressure. Solana Battles To Hold Ground At Lower Levels Solana is currently trading at $139 after failing to reclaim the 200-day Moving Average (MA) and Exponential Moving Average (EMA), which sit around the $184-$186 resistance zone. The inability to break above these critical levels has left bulls in trouble, as SOL struggles to hold the $140 support and now risks setting fresh lows below $125. The bearish momentum has kept SOL under pressure, with price action confirming a continued downtrend. If sellers gain more control and $140 fails to hold, a breakdown below $125 could trigger further downside, forcing SOL into lower demand zones. However, despite the current weakness, theres still a chance for recovery. If bulls can push SOL back above $180, reclaiming this critical level could shift market sentiment and trigger a strong recovery move. A decisive breakout above this zone would invalidate the bearish outlook, signaling a potential push toward higher resistance levels. Related Reading: Bitcoin Could Gain Momentum For A Move To $150,000 If Bulls Reclaim This Level Details For now, traders are watching closely to see whether Solana can hold its key support or if another leg down is inevitable. The next few days will be crucial in determining whether SOL can stabilize or face deeper losses in the short term. Featured image from Dall-E, chart from TradingView
The Ethereum price has finally broken out of a months-long consolidation pattern, signaling the possible start of a significant bullish move. The recent breakout of an Ascending Triangle formation suggests that ETH is set for more gains, with a crypto analyst suggesting a price target of $7,800 in the coming months. Ethereum Price Targets $7,700 ATH The Ethereum price is believed to be targeting a new all-time high of $7,800 after its recent breakout from an Ascending Triangle. For months now, the cryptocurrency has been trading within this classic bullish chart pattern, where prices make higher lows while facing strong resistance at a fixed level. Related Reading: Ethereum Is Not Dead: Broadening Wedge Suggests Another Leg-Up Is Coming This consolidation pattern has been active since late 2024, establishing strong resistance at $4,000. TradingView analyst Sohaibfx has predicted that if Ethereum can surpass this resistance level, it would confirm a bullish trend, leading to a strong upward continuation in its price. Looking at the analysts price chart, Ethereum spent several months navigating between $2,000 and $4,000 in Q1 2025. This region represented an accumulation phase where buyers had quietly built their positions in anticipation of a potential rally. A descending channel marked in orange in the price chart also shows that Ethereum had experienced a significant pullback mid-to-late 2024 before breaking out. This was likely the final shakeout before it regained its bullish momentum. According to Sohaibfx, a measured move of the Ascending Triangle suggests that Ethereum is poised for an explosive 333% surge to $7,800. This bullish target is calculated by determining the height of the triangle, which is the difference between its base at $2,000 and resistance level at $4,000. When the price breaks above the resistance, the common method for estimating the possible next move is to add the triangles height to the breakout point, which gives a technical target of $6,000. However, based on past price behaviour and strong buying momentum, the Ethereum price could push even higher, with $7,800 being a key psychological level. Support Levels And Momentum Indicators To Watch In his price analysis, Sohaibfx has pinpointed the $4,000 and $3,000 price levels as support levels for Ethereum. This support should act as a safety net, where buyers are likely to step in to prevent further decline after Ethereum reaches its projected $7,800 target. Related Reading: Ethereum Price Maintains Movement Inside Ascending Triangle, Is Another Crash Coming? Moving forward, the analyst highlights key momentum indicators that should be monitored. While the analysts chart does not specify indicators like Moving Average Convergence Divergence (MACD) or Relative Strength Index (RSI), Ethereums sharp upward move suggests that strong momentum will be a major contributor to its rise to a new ATH. Sohaibfx has advised traders to watch out for RSI levels above 70, as overbought conditions could signal a potential pullback while Ethereum approaches higher levels. Featured image from Adobe Stock, chart from Tradingview.com
Bitcoin (BTC) is starting its upmove and its liquidation range fluctuates between $89,000 to $83,000 or even lesser than $83,000. On Wednesday, Daan Crypto Trades pointed in an X post that $89K-$90K is an important level because it marks the range lows. Daan notes that Bitcoin is still behaving similarly to equities and has attracted […]
World Crypto Global opens the door to digital freedom for everyone.
Manage your free WCG Coins securely—where simplicity meets global accessibility.
FREE CRYPTO COINS
AVAILABLE FOR RESERVATION
ALREADY ALLOCATED

No fees. No catch. Your crypto journey starts here.