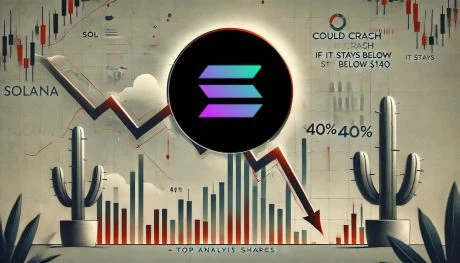
Solana Retests Bearish Breakout Zone $65 Target Still In Play?
Solana is trading above the $125 level after bulls stepped in and reclaimed key levels, sparking optimism across the market. After enduring weeks of massive selling pressure, this recovery marks the first sign of strength from buyers since early March. Still, not all analysts are convinced this marks the beginning of a sustainable rally. While momentum appears to be shifting in Solanas favor, some see this move as a possible bearish setup rather than a reversal. Related Reading: Ethereum Metrics Reveal Critical Support Level Can Buyers Step In? Top crypto analyst Ali Martinez shared a cautionary view on X, suggesting that Solana might be retesting the breakout zone from a right-angled ascending broadening pattern a structure that often precedes sharp declines. According to his analysis, if Solana fails to hold current support levels, prices below $80 could come back into play. This aligns with broader macro concerns, as global trade tensions and volatile risk markets continue to pressure crypto valuations. With both bullish enthusiasm and bearish warnings in the air, Solanas price action in the coming days could determine whether this is a genuine recovery or a setup for a deeper correction. Eyes are now on how SOL behaves around $125 in the short term. Solana Faces a Pivotal Test as Global Risks Rise Solana is at a crucial juncture as bulls attempt to hold the $125 level and regain momentum after weeks of aggressive selling pressure. While the recent bounce has offered short-term relief, the broader market environment remains highly unstable, making this recovery fragile. Macroeconomic uncertainty, paired with growing trade war fears, continues to weigh heavily on risk assets like Solana. The erratic tone set by US President Donald Trump, including unpredictable tariff policies targeting China and other global partners, has introduced renewed volatility across financial markets. These macro headwinds are colliding with technical pressure in Solanas chart. Martinez shared a bearish scenario, noting that Solana could be retesting the breakout zone from a right-angled ascending broadening pattern. Historically, this pattern often signals the potential for sharp reversals. According to Martinez, if Solana fails to hold above key support, the price could plunge toward $65 a level not seen since late 2023. The $125 zone now acts as a make-or-break level for bulls. Reclaiming higher resistance at $135$145 would be necessary to shift sentiment and spark a full recovery rally. However, failure to hold current levels could result in a steep decline as panic returns to the market. Related Reading: Dogecoin Whales Buy 800 Million DOGE in 48 Hours Smart Money Or Bull Trap? SOL Price Faces Key Resistance After $136 Rejection Solana (SOL) is currently trading at $125 after facing a clean rejection at the $136 resistance level earlier this week. The failure to break through this short-term ceiling has paused the bullish momentum, placing bulls in a vulnerable position as they try to defend recent gains. To regain control and signal a clear reversal, SOL must reclaim the $136 level with conviction and continue climbing toward the $150 mark a zone that aligns with key daily resistance and short-term liquidity. Reclaiming both levels would signal strong market confidence and could set the stage for a sustained rally, possibly retesting April highs. However, without that upside push, the risk of deeper downside grows. Market volatility remains high, fueled by global macroeconomic tensions and uncertainty around US-China trade developments. These factors are still weighing heavily on sentiment, particularly among altcoins like Solana. Related Reading: XRP Tests Ascending Triangle Resistance Can Bulls Reach $2.40 Level? If SOL continues to struggle below $136 and fails to attract enough buying pressure, a breakdown toward the $100 mark becomes increasingly likely. That level has previously served as a psychological support zone and could attract renewed interest but only if broader market conditions stabilize. For now, SOL remains in a delicate, high-stakes trading zone. Featured image from Dall-E, chart from TradingView