AARON: Oceans DATUM Is Tackling Bitcoins Most Pressing Problem
Ocean's DATUM is since this weekend putting transaction selection back into the hands of hashers, benefiting Bitcoin's censorship resistance.
Loading
Welcome at World Crypto Global. This portal is packed with useful content and resources to built out your own crypto skills. WorldCrypto is a site member of Gabriel Vega Network.

Ocean's DATUM is since this weekend putting transaction selection back into the hands of hashers, benefiting Bitcoin's censorship resistance.
Ocean's DATUM is since this weekend putting transaction selection back into the hands of hashers, benefiting Bitcoin's censorship resistance.
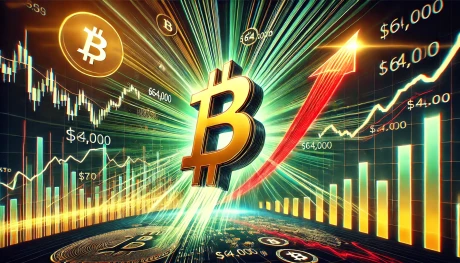
On-chain data shows that the Bitcoin short-term holder whales have a cost base above $64,000, which could be a potential resistance point for BTC. Bitcoin Is Not Far From Realized Price Of Short-Term Holder Whales After Rally As pointed out by an analyst in a CryptoQuant Quicktake post, the BTC price had slipped below the Realized Price of the short-term holder whales earlier. The “Realized Price” here refers to an indicator that keeps track of the average cost basis that the investors of a particular group currently share. Related Reading: Bitcoin NVT Golden Cross Gives Bottom Signal: What Happened Last 2 Times When the asset’s spot price is under this metric, the holders belonging to the cohort are in a state of net unrealized loss. Similarly, it being above the indicator implies the group is enjoying profits. In the context of the current topic, there are two market segments of interest: the short-term holder and long-term holder whales. The short-term and long-term holders are the two main divisions of the Bitcoin sector based on holding time. The short-term holders (STHs) are the investors who bought their coins within the past 155 days, while the long-term holders (LTHs) include the hands who have kept their coins dormant for longer than this period. The “whales” generally refer to the entities that carry at least 1,000 BTC in their wallets, so the STH and LTH whales would naturally correspond to the large members of the respective cohorts. Now, here is a chart that shows the trend in the Realized Price for these two Bitcoin groups over the past few years: As displayed in the above graph, the Bitcoin spot price had slipped considerably below the Realized Price of the STH whales during the recent market downturn. However, with the price observing recovery, it has now neared back to that level. The average cost basis of the STH whales is between $64,000 and $65,000, so a retest of it could be coming soon. However, Such a retest could prove difficult for the cryptocurrency. The STHs represent the weak hands of the market, which can be sensitive to changes in the market. The cost basis is naturally an important level for any investor, but this cohort especially can be likely to react when such a retest happens. Since most STH whales have been at a loss recently, some may be desperately looking forward to a retest taking place so they can exit from the market at their break-even level. It remains to be seen whether Bitcoin will overcome this obstacle if the current recovery rally continues that far. Related Reading: XRP Sharks & Whales Push Bags To ATH As Price Rockets 19% While the STH whales suffer losses, the LTH whales continue to be in high profits as their Realized Price is at just $22,000, implying that their patience has paid off. BTC Price Bitcoin had briefly broken above $62,000 during the past day, but the coin’s price has since seen a retrace to $60,500. Featured image from Dall-E, CryptoQuant.com, chart from TradingView.com
Bitcoin price is finally seeing some relief, but it faces significant resistance at the $68,000 mark, which would trigger over $700 million worth of short liquidations.
Researchers are using AI to resurrect DNA from extinct species to combat drug-resistant pathogens, potentially revolutionizing antibiotic discovery. (Read More)
Leading Bitcoin advocates and entrepreneurs are meeting with human rights activists to explore the imperative of censorship-resistant money in the fight against authoritarianism.
OFAC sanctions Nordic Resistance Movement for violent extremism and crypto-funded terrorism. (Read More)
On-chain data suggests Litecoin potentially has a major amount of resistance waiting just ahead, making a recovery more difficult for LTCs price. Litecoin Has A Large Supply Wall Waiting At Levels Just Ahead As pointed out by X user Trader Kamikaze using data from the market intelligence platform IntoTheBlock, a large amount of LTC investors [...]
The post Litecoin In Uphill Battle: Strong Resistance Might Block Recovery appeared first on Crypto Breaking News.
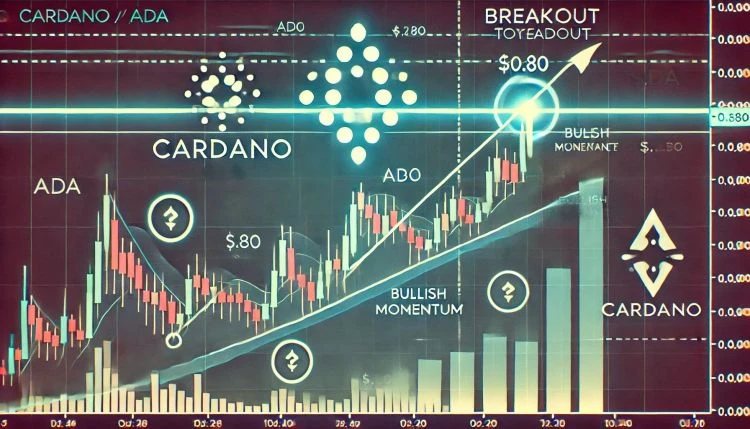
Cardano is gaining bullish traction, pushing above the $0.70 mark as it attempts to reclaim the $0.75 resistance level. With Bitcoin surging toward the $100K barrier and Ethereum breaking out above $1,900, the broader crypto market is heating upand ADA is beginning to ride that wave of renewed optimism. The return of volatility and bullish momentum has sparked excitement across major altcoins, with Cardano standing out as one of the most promising setups. Related Reading: Bitcoin Shows Impressive 4H Strength A Shift Toward Upside Break Top analyst Ali Martinez shared a technical analysis highlighting that Cardano looks poised for a potential breakout toward $0.80. According to Martinez, ADA is approaching the upper boundary of its current trading channel, and a decisive move above $0.75 could trigger a sharp rally. With key support holding firm and market sentiment shifting in favor of bulls, the setup suggests ADA may be preparing to enter a new phase of price discovery. As the market recovers from months of uncertainty and selling pressure, investors are closely watching whether Cardano can sustain this momentum. A confirmed breakout above $0.75 would not only validate Martinezs outlook but also strengthen ADAs position in the broader altcoin rally now unfolding. Cardano Faces Key Resistance Test As Momentum Builds Cardano is facing a pivotal test as it trades near the upper boundary of a key resistance zone, just as broader market momentum begins to accelerate. Since bottoming out in early April, ADA has surged more than 40%, showing one of the strongest recoveries among major altcoins. This bullish move comes as Bitcoin approaches the $100K mark and Ethereum attempts to break and hold above $2,000, bringing renewed optimism to the crypto space. Despite the strength, Cardano still trades below a critical resistance level defined by the upper boundary of a long-standing descending channel. According to Martinez, a decisive breakout above this trendline could trigger a sharp move toward $0.80. Martinezs analysis suggests that ADA is coiling with strength and is on the verge of a breakout, but the confirmation must come with a clean close above $0.75. However, the macro backdrop remains a wildcard. Ongoing tensions between the US and China, combined with the US Federal Reserve’s tight monetary policy stance, continue to influence risk asset behavior. As a result, traders remain cautious even as bullish setups appear. For Cardano, the current structure is promising. A confirmed breakout would signal renewed buyer strength and open the path to higher price levels, while failure to clear resistance could result in renewed consolidation. In either case, ADA is approaching a decision point, and the next few trading sessions could set the tone for its short- to mid-term trend. If bulls manage to flip resistance into support, Cardano could quickly accelerate toward the $0.80 targetand potentially higher if momentum across the market continues to build. Related Reading: XRP Bulls Expect A Breakout As Price Compresses Between Key Levels Details ADA Price Analysis Key Levels To Reclaim Cardano (ADA) is trading at $0.7232, posting a strong +7.70% daily gain as it pushes toward key resistance levels. The daily chart shows ADA breaking above both the 200-day EMA ($0.7101) and nearing the 200-day SMA ($0.7832), signaling a resurgence in bullish momentum. This move follows a multi-week consolidation period where ADA repeatedly tested lower support around $0.65, forming a stable base. The recent breakout is notable because it comes amid increased volume and broader market strength, with Bitcoin and Ethereum also surging toward key psychological levels. ADA is now approaching the upper boundary of a descending channel that has constrained price action for several months. A decisive daily close above $0.75 would confirm a breakout and open the door to a potential rally toward the $0.80$1.00 range. However, until ADA clears the $0.78$0.80 region with conviction, traders should watch for possible rejection and another pullback toward the $0.70 support zone. Still, the structure remains bullish, and current momentum suggests buyers are preparing to retake control. Related Reading: Cardano Struggles At Resistance Expert Sees A Retest of Lower Support Levels If macro conditions remain stable and altcoin sentiment continues to improve, Cardano may be entering a new phase of upside expansionone that could finally break its long-term downtrend. Featured image from Dall-E, chart from TradingView
J. Christian Giancarlo has stressed the importance of upholding values of liberty, privacy and economic freedom in a keynote address in London.
HBAR is gaining bullish strength amid overall market recovery from its weeks of volatility. With the recovery of BTC from support levels, altcoins like HBAR are gaining strength, offering traders and investors optimism for the breakthrough. A continuation above current levels of resistance may mark the start of a bullish trend. At the time of […]
Solana (SOL) continues to rise after breaking through a major resistance level and indicating strength within its existing uptrend. A formation of an ascending triangle pattern, which tends to be a positive indicator, reinforces the positive outlook. Traders and long-term investors are both watching intently in hopes of the potential for a long-term rally. If […]
XRP price forecasts have taken a dramatic turn as bold predictions surface, suggesting that the cryptocurrency could be on the verge of a parabolic 64,000% rally to $1,700. Analysts backing this ambitious forecast point to historical price patterns and XRPs current technical structure as the basis for their end-of-the-year predictions. A chart shared by crypto analyst The Real Remi Relief on X (formerly Twitter) shows that XRP is mirroring a technical pattern that preceded its 2017-2018 historical bull run one that saw the third largest cryptocurrency skyrocket by tens of thousands of percent in just a few months. Now that this historical pattern is unfolding, the analyst has confirmed that a breakout is on the horizon for XRP, with projections pointing toward a potential price target as high as $1,700. XRP Price End Of Year Forecast The chart shows two distinct consolidation phases in XRPs price action the first spanning from 2014 to 2017 and the second lasting from 2018 until early 2024. During both periods, the cryptocurrency underwent a long-term compression under a descending resistance line. This compression was followed by a breakout, retest, and vertical price expansion. Related Reading: XRP Moves Into Key Range Against Bitcoin As 3 Major Targets Show Up Notably, this breakout in 2017 led to XRP reaching its historical all-time high of $3.84 a level it hasnt revisited for over six years. Earlier this year, XRP experienced a similar breakout that pushed it above the multi-year downtrend. The current chart shows that the cryptocurrencys retest is holding steady, and this pattern has previously preceded massive rallies during the past bull cycles. As a result, Real Remi Relief argues that history is on the verge of repeating itself. According to his end-of-year forecast for XRP, the cryptocurrency is poised for a staggering 64,000% rally, placing its price at a jaw-dropping $1,700 per token by as early as Q4 2025 or Q1 2026. While the timeline could extend into the following year, the outlook still frames 2025 as a bullish turning point for XRP, with strong potential for the altcoin to close the year in a strong green. Interestingly, the crypto expert has also shared a more conservative target, predicting that XRP could record a still ambitious, but more realistic surge to $1,200 by years end. XRP Could Skyrocket Even Higher By 150,000% While the Real Remi Reliefs $1,700 price projection for XRP is undeniably bold, the analyst goes even further, speculating that the cryptocurrencys total upside potential in this cycle could soar as high as 80,000% and 150,000%. This surge could catapult XRPs current price of $2.4 to an astonishing $1,920 and $3,600, respectively. Related Reading: XRP: Exit Liquidity Pattern Forming Signals Crash To $1 Such gains would not only eclipse XRPs previous all-time high but also represent one of the most dramatic asset revaluations in crypto history. Skepticism remains, of course, particularly amongst commentators under the analysts X post, who view this bold forecast as an almost impossible goal. Featured image from Adobe Stock, chart from Tradingview.com
Aptos (APT) is trading at $5.24, having appreciated 6.96% in recent trading days. This is, however, driven by an overall 22.80% drop in 24-hour trade volumes, which are now at $131.28 million, indicating short-term investor interest may be weakening. The price of the token has corrected from its high of $10.47 to about $5.22, where […]
Ethereums Dankrad Feist and Helius Labs CEO Mert Mumtaz clash on X over the importance of decentralization, revealing differing views on the crypto markets priorities.
Bitcoin could be on the brink of a rally to new record highs, but it still has one significant resistance to overcome, according to Markus Thielen.
SUI is now trading at a pivotal level after confirming a bullish structure on the short-term chart. Following a strong recovery from its local lows in early April, the Layer-1 token has steadily climbed, showing clear signs of renewed investor interest. However, while the uptrend remains intact, the $4 resistance zone stands as the next major obstacle that bulls must overcome to confirm a decisive breakout. Related Reading: HYPE Confirms Strength With Solid Throwback Response Bullish Reversal? Market sentiment has been shifting as altcoins regain strength alongside Bitcoins consolidation above $95K. In this context, SUI has emerged as one of the stronger performers. Still, the challenge lies in clearing the $4 level with volume, which could unlock further upside potential and open the path toward price discovery. Top analyst Kaleo shared an insightful analysis on X, noting that SUI is gaining momentum and looks poised to reclaim the $4 mark soon. According to Kaleo, this level could act as the launchpad for the next leg higher, provided bulls maintain pressure and volume supports the move. With macro uncertainty still clouding the broader market, SUIs upcoming price action could serve as a barometer for altcoin strength in the near term. SUI Leads Altcoins As Bulls Target $4 SUI has emerged as one of the most resilient and promising Layer-1 (L1) blockchains in the current market cycle. A Layer-1 blockchain refers to the foundational network infrastructure of a blockchain ecosystemexamples include Ethereum, Solana, and now SUI. These platforms host smart contracts and decentralized applications (dApps), and their strength often defines how much developer activity and user engagement they attract. In this context, SUI is positioning itself as a serious contender in the competitive L1 space. Amid growing volatility and macroeconomic uncertainty, SUI has held up remarkably well, showing strength even as other altcoins remain trapped in consolidation. Its relative strength against Bitcoinoften a key indicator of altcoin momentumhas not gone unnoticed. Kaleo recently noted that SUI is displaying a solid performance versus BTC and appears ready to reclaim the $4 level, a major resistance area that has capped the upside for weeks. A clean break above $4 could trigger a broader rally, especially if market conditions remain favorable for altcoins. However, despite the bullish signals, risks remain high. Some analysts warn that the market could face another retrace as global tensions and uncertain liquidity conditions continue to shape sentiment. In such an environment, investors are watching closely to see if SUI can defy the trend. Its recent strength suggests it could outperform other L1s during the next phase of the market, especially if capital rotates back into high-potential altcoins. Related Reading: Dogecoin Whales Buy 100 Million DOGE In 24 Hours Demand Signals Growing Confidence With bullish structure intact and volume beginning to build, SUI could be one of the first major altcoins to lead the chargeif the breakout above $4 confirms. Price Holds Key Support Ahead Of Breakout Test SUI is currently trading at $3.46, holding firm above the 200-day moving average (MA), which sits around the $3.25 level. This key technical support has acted as a strong foundation during recent volatility, signaling that bulls still maintain control of the short-term structure. As long as SUI stays above this zone, the possibility of continuation remains intact. The next major hurdle lies at the $4 marka psychological and technical resistance level that has rejected price advances several times in recent weeks. A decisive breakout above $4, followed by a close above the $4.20 area, would confirm a bullish setup and could trigger further upside momentum toward new highs. However, caution is warranted. If SUI fails to reclaim $4 and slips below the $3.20 level, it may test deeper support near the $2.80 zone. Losing this range could shift sentiment and open the door to a broader correction, especially if weakness returns to the overall altcoin market. Related Reading: Whales Sell 262,000 Ethereum Amid Recent Price Surge Smart Exit Or Profit-Taking? For now, bulls are in a position of strength, but confirmation requires sustained buying pressure and a clean breakout above overhead resistance. The coming sessions will be key in determining whether SUI can lead the next altcoin rally. Featured image from Dall-E, chart from TradingView
SEI has seen a bullish breakout occur for the first time since October and it remains above important support.
After weeks of consistent buying pressure and bullish sentiment, Chainlink (LINK) is now facing a critical moment. The price failed to reclaim the $18 resistance level and has since dropped more than 16%, showing signs of weakening momentum. This recent rejection has sparked concerns among investors and traders, as downside risk intensifies in the short term. Related Reading: Cardano Whale Activity Spikes 80 Million ADA Added In 48 Hours Top crypto analyst Ali Martinez shared a technical analysis pointing to a potential retracement toward lower demand levels. According to Martinez, the recent failure to break above key resistance may trigger further selling pressure, especially if broader market conditions remain uncertain. He suggests that LINK appears to be losing its bullish structure and could be preparing to revisit lower support levels before any meaningful rebound. Chainlinks current position highlights a shift in sentiment, as bulls struggle to hold key zones. While the broader market remains relatively stable, LINK’s inability to maintain higher levels could signal an early sign of deeper correction if volume and momentum do not pick up. With volatility returning to the altcoin space, the coming days will be decisive for Chainlink. Holding above interim supports will be key if bulls want to regain control and avoid further losses. Chainlink Struggles As Momentum Fades: Downside Risks Grow Chainlink (LINK) is showing signs of exhaustion after weeks of upward movement, now trading under mounting pressure as the market grapples with renewed volatility and global financial uncertainty. Bulls remain active, defending key demand zones and continuing to call for a breakout, but fading momentum and growing fear are starting to weigh on sentiment. The failure to breach the $18 resistance level marked a turning point. Since then, Chainlink has slipped over 16%, losing critical support zones and entering a vulnerable technical position. According to Martinez, this rejection could be the start of a deeper correction. Martinezs analysis suggests that LINK is now poised to revisit the $10 level a psychological and structural support that aligns with historical price behavior. The next few trading sessions will be crucial. If bulls cant reclaim higher levels or at least stabilize price action above $14, the selling pressure could accelerate. Adding to the uncertainty is a broader lack of clarity in global markets, with investors closely watching central banks, inflation data, and geopolitical developments for guidance. While some traders are still positioning for a bounce, the current structure points to caution. Chainlinks performance in the coming days could either confirm a local top or offer a high-risk, high-reward entry point if support holds and momentum returns. Either way, the $10$12 range may soon be tested, and how LINK responds there will define its next major trend. Related Reading: XRP Flashes Bullish Signal Technical Indicator Hints At Imminent Rebound LINK Faces Pullback As Buy Pressure Weakens Chainlink (LINK) is under pressure after failing to hold above the $17.50$18 resistance zone. The daily chart shows a sharp rejection near the 200-day SMA (currently at $17.79), followed by a 16% drop that pushed LINK below the 200-day EMA ($16). This move confirms a breakdown of bullish momentum and highlights growing downside risk as traders reassess short-term expectations. Volume has picked up during the recent pullback, suggesting active profit-taking or renewed selling interest. The current support zone lies around $14.80$15.00, a region previously tested in late April and early May. If bulls fail to hold this level, the next major support rests closer to $13.20, potentially opening the door for a deeper correction toward the $10 markan area cited by analyst Ali Martinez. Related Reading: Ethereum Faces Resistance Against Bitcoin ETH/BTC Bullish Structure In Question To regain momentum, LINK must first reclaim the $16 zone and flip the 200 EMA back into support. A daily close above both the 200 EMA and SMA would shift sentiment and restore the bullish structure. Until then, traders should watch for continuation signals or further weakness, especially if broader market volatility persists. LINK is in a make-or-break phase, with the next few days likely to set the tone for its short-term trajectory. Featured image from Dall-E, chart from TradingView
The TRUMP meme coin has recently made waves in the cryptocurrency market, showing strong performance despite ongoing volatility. Over the past 30 days, TRUMP has surged nearly 45%, reflecting growing investor interest and mirroring the broader bullish momentum in the altcoin space. However, with the market facing a short-term correction, including declines in Bitcoin and […]
World Crypto Global opens the door to digital freedom for everyone.
Manage your free WCG Coins securely—where simplicity meets global accessibility.
FREE CRYPTO COINS
AVAILABLE FOR RESERVATION
ALREADY ALLOCATED

No fees. No catch. Your crypto journey starts here.