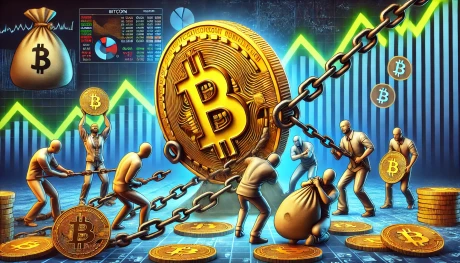
Up to 99% of Mt. Goxs $8.2B Bitcoin could be sold Analyst
Nearly all of Mt. Goxs former creditors might be looking to sell their Bitcoin, which has increased by over 8,500% in value in the 10 years since the exchanges collapse.
Loading
Welcome at World Crypto Global. This portal is packed with useful content and resources to built out your own crypto skills. WorldCrypto is a site member of Gabriel Vega Network.

Nearly all of Mt. Goxs former creditors might be looking to sell their Bitcoin, which has increased by over 8,500% in value in the 10 years since the exchanges collapse.
Miner revenues soar 50%, pushing Bitcoin hashrate higher and reducing selling pressure from miners reserves.
Another wave of Bitcoin could be flooding the market as Mt. Gox prepares to continue creditor repayments. Will 99% of the Mt. Gox creditors really sell their Bitcoin?
The crypto market could bounce back this month after a rocky June, with stablecoin outflow from exchanges showing slowing selling pressure.
Repeated Bitcoin transfers to centralized exchanges suggest the government plans to sell its $2.75 billion in BTC holdings.
Bitcoin whales continue accumulating, despite the potential sell pressure from Mt. Gox creditors, which could see 99% of investors selling.
Only the holders with the least conviction will be selling Bitcoin on the Mt. Gox repayment news, according to popular on-chain analyst ZachXBT.
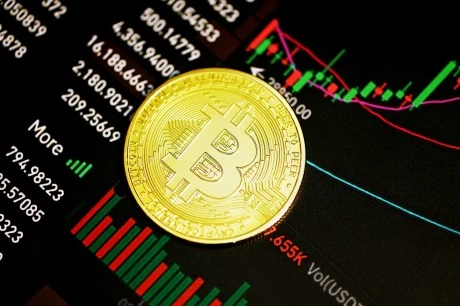
On-chain data shows that Bitcoin long-term holders have potentially been selling recently, something that may explain BTC’s continued bearish momentum. Bitcoin Exchange Inflow CDD Has Registered Huge Spikes Recently As an analyst in a CryptoQuant Quicktake post explained, old cryptocurrency tokens have recently been deposited in large quantities in centralized exchanges. The on-chain metric of interest here is the “Exchange Inflow Coin Days Destroyed (CDD).” A “coin day” refers to a quantity that 1 BTC accumulates after staying dormant on the blockchain for 1 day. Related Reading: Bitcoin Crash Forced Weak Hands Into Largest Loss-Taking Since 2022 Lows: Report When a coin that had been sitting still inside a wallet is finally moved, its coin days counter naturally resets back to zero, and the coin days it had been carrying before the move are said to be “destroyed.” The CDD keeps track of the total amount of coin days being reset in this manner across the network. In the context of the current topic, though, the general CDD isn’t the one of focus, but rather the Exchange Inflow CDD, which only keeps track of the coin days being destroyed through transactions into wallets connected to exchanges. Now, here is a chart that shows the trend in the Bitcoin Exchange Inflow CDD over the past month or so: As is visible in the above graph, the Bitcoin Exchange Inflow CDD has registered some spikes of considerable scale this month. This would imply that many dormant coins have recently seen deposits into exchanges. Generally, spikes in the CDD correlate to movement from the long-term holders (LTHs), as these HODLers tend to accumulate large amounts of coin days. Therefore, the recent spikes in the Exchange Inflow CDD suggest that these diamond hands have been transferred to exchanges. Holders make transactions into exchanges when they want to use one of the services these platforms provide, which can include selling. The chart shows that the spikes earlier in the month had come when Bitcoin had plunged towards its lows, implying that the selling pressure from this cohort may have played a role in the crash. The latest spike, larger in scale than the others, has come while BTC has been trying to start a recovery rally from these recent lows. So far, BTC has had no luck, suggesting that the selling from the LTHs has potentially been holding the coin back. Related Reading: Chainlink Traders Capitulate After 10% Plunge: Bottom Here? It remains to be seen how the Exchange Inflow CDD behaves in the coming days and if any potential further spikes would impede Bitcoin in its path to recovery. BTC Price At the time of writing, Bitcoin is trading at around $57,900, up more than 4% over the past week. Featured image from Dall-E, CryptoQuant.com, chart from TradingView.com
Weak tech corporate earnings, spot Bitcoin ETF inflows and the potential arrival of a new major investor drove Bitcoin price above $63,000.
In an analysis provided by CryptoQuant, a significant change in Bitcoin miner behavior has been noted, potentially indicating a turning point. CryptoQuant analyst, known as Crypto Dan, outlined a reduction in miners’ selling pressure, which has historically been a pivotal factor affecting Bitcoin’s price trajectory. Bitcoin Mining Selling Pressure Decreases According to Crypto Dan, “Miners’ selling pressure decreases. One of the whales that have caused the cryptocurrency market to fall recently have been miners.” He explained that the BTC halving, which halved mining rewards, led to a decrease in the use of older, less efficient mining rigs, subsequently reducing overall mining activity. This change forced miners to sell Bitcoin in over-the-counter (OTC) transactions to sustain their operations. The analysis suggests that the market is currently absorbing the sell-off, with a notable decline in the volume and frequency of Bitcoin being transferred out of miners’ wallets. “The current market can be seen as being in the process of digesting this sell-off, and fortunately, the quantity and number of Bitcoins miners are sending out of their wallets has been rapidly decreasing recently,” Crypto Dan stated. Related Reading: BlackRock Global Allocation Fund Reveals Major Bitcoin ETF Stake With 43,000 Shares The implications of this shift are significant. Crypto Dan added, “In other words, the selling pressure of miners is weakening, and if all of their selling volume is absorbed, a situation may be created where the upward rally can continue again.” He projected optimism for the market, predicting positive movements in the third quarter of 2024. Historical data from CryptoQuant corroborates the analysis. BTC has previously shown a similar pattern where miner selling activity exerted a strong influence on market prices, particularly noted from May to September 2023 and from December 2023 to January 2024. During these periods, prolonged sideways movement in BTC prices was observed, aligning with peaks in miner selling. Notably, when these selling activities diminished, Bitcoin prices resumed an upward trend. This pattern suggests that the recent decrease in miner selling could be the precursor to another significant bullish phase for Bitcoin, as market conditions appear ripe for a similar reversal of fortunes. Key Price Level For A Bullish Breakout Further insights from technical analysts at alpha dj provide a granular view of the market conditions. Their daily update on Bitcoin through X underscores the current market indecision, characterized by Bitcoin “chopping around” without clear directional movement. However, the analysts have identified critical price levels which could indicate future market movements: “If BTC reclaims the $63.5k area, it would be bullish; if it loses the $60k level, it would be bearish.” Related Reading: Fears Of Bitcoin Sales By US And German Govts Are FUD, Even Bullish: Experts The technical analysis also reveals that the liquidity in the Bitcoin market is currently dispersed, with few substantial clusters of orders. The most notable concentration of orders is around the $63.5k level, suggesting that this price point is pivotal for market sentiment and potential bullish momentum. The order book data provided by alpha dj highlights a current dominance of sell orders, indicating a bearish sentiment among traders. Conversely, the bid side is described as weak, with fewer buy orders supporting upward price movements. This imbalance suggests that the market is currently cautious, potentially awaiting more definitive signals before committing to more substantial positions. At press time, BTC traded at $61,704. Featured image created with DALL·E, chart from TradingView.com
The price of Bitcoin is on the rise once again, reaching $9,800 amidst talks of Federal Reserve interest rate cuts and demands from President Donald Trump. This surge in value has left many investors excited about the future of the cryptocurrency market. The Federal Reserve is considering cutting interest rates in response to economic uncertainties [...]
Dogecoin has reached $0.15, but its meeting resistance, and its momentum is now fading. Many traders are looking at $0.13 as possible support.
Despite the excitement around the Hong Kong ETF debut, the inflows are only a fraction of the outflows from U.S. ETFs. Could the Bitcoin price revisit the $50,000 mark next?
Bitcoin is facing growing risks of a pullback as bullish momentum begins to fade near key resistance. After weeks of impressive gains, BTC is now consolidating in a tight range just below its all-time high, with buyers struggling to push the price into price discovery. This ongoing indecision has raised concerns among traders and analysts, who are closely watching for signs of either a breakout or a deeper retracement. Related Reading: Ethereum Multi-Year Consolidation Could Spark A Parabolic Move Details Crypto analyst Daan offered a broader perspective on the situation, noting that Bitcoin initially surged in response to the recent tariff-related tensions, significantly outperforming equities in the process. However, as trade uncertainty began to ease and traditional markets regained momentum, Bitcoin lost steam and failed to follow through. While stocks continued their uptrend, BTC stalledan unusual divergence that suggests caution may be creeping back into the crypto space. With the price now hovering around the $103K mark and key resistance near $105K remaining untouched, bulls must act decisively to reclaim control. A failure to do so could trigger a larger correction, especially if macro conditions shift or equity markets show renewed weakness. For now, all eyes are on the range and which side breaks first. Bitcoin Bulls Eye Breakout But Caution Grows Near Resistance Bitcoin is just 5% away from its all-time high of around $109,000, trading near $103K as bulls attempt to reclaim momentum. After weeks of strong upward movement and consolidation above key levels, many analysts believe BTC is preparing for a decisive breakout. If price can clear the $105K resistance, it could trigger a new leg into price discovery and signal the start of a powerful bull phase. However, selling pressure at current levels remains strong. Bitcoin has struggled to break higher, and some traders see this consolidation as a sign of potential exhaustion. Daan offered insights on the recent behavior, noting that BTC surged sharply following the tariff-related macro drama, outperforming equities in the process. Yet, as some trade uncertainty faded, stocks kept climbing while BTC stalled near resistance. Daan considers $90K his line in the sand for long-term spot exposure. If Bitcoin were to drop below that mark, it would suggest a structural breakdown that hasnt occurred during this cycle. For now, he remains cautiously bullish while BTC stays above that level, but admits the risk-reward was more attractive when BTC was 2030% cheaper. He also warns that if equities correct after their aggressive ralliesmany stocks have surged 3050% in a single monthit could drag Bitcoin lower in a short-term flush. With BTC showing relative weakness near resistance, the next move will be critical for confirming either continued upside or the start of a broader pullback. Related Reading: Dogecoin Whales Accumulate 1 Billion DOGE In A Month: Fueling Price Surge Speculation Tight 4H Range Signals Imminent Price Breakout The 4-hour chart shows Bitcoin consolidating tightly between $105,700 resistance and $100,700 support, creating a narrow range that suggests a strong move is imminent. Price has been ranging sideways for several days, with multiple failed breakout attempts above $103,600. This level continues to act as a key barrier for bulls. Notably, Bitcoin remains above both the 200 EMA ($96,121) and the 200 SMA ($94,622), reinforcing the medium-term bullish structure. Momentum is neutral in the short term, as shown by the indecisive price action and declining volume. However, the trend remains intact as long as BTC holds above $100,000 the psychological and technical line in the sand. If price breaks above $103,600 with volume, it could trigger a move toward the $105,000$109,000 range and initiate a push into price discovery. On the other hand, failure to hold this support zone could open the door for a quick flush to retest the $98,000$96,000 area, where the moving averages align. Related Reading: Solana Sees Renewed Demand As Capital Flows Turn Positive Details Traders should watch for a clear breakout or breakdown, especially as moving averages and prior highs converge. This tight setup rarely lasts long, and a decisive move could define Bitcoins trend for the rest of the month. Featured image from Dall-E, chart from TradingView
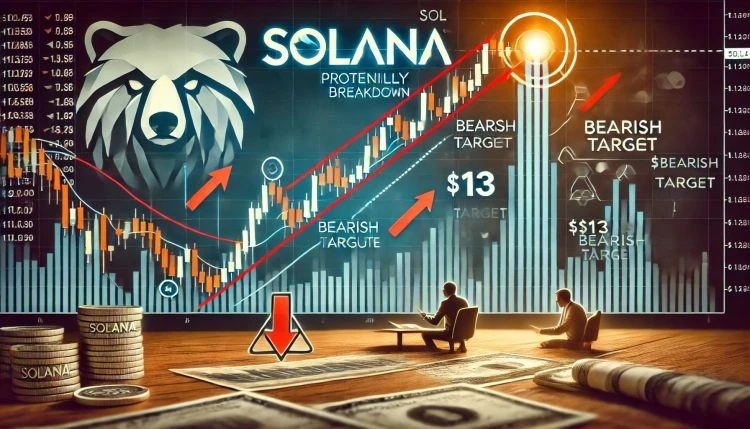
Solana is now trading below the $100 mark after intense selling pressure swept through the crypto market over the weekend. Sundays drop pushed SOL into its lowest price zone in more than a year, signaling a sharp shift in sentiment as fear grips the market. Since the start of March, Solana has lost more than 45% of its value, and momentum suggests the downtrend may not be over yet. Related Reading: Dogecoin Faces Make-Or-Break Support Level Will DOGE Hold? The breakdown has sparked concern among investors and analysts alike, with many warning that SOL could be headed for deeper lows if current support fails to hold. Top analyst Jason Pizzino shared a technical analysis pointing out that this is the first time in over 12 months that Solana is trading below the $100 level a historically significant threshold. According to Pizzino, the next major price targets sit at levels levels that would represent an 80% total decline from Solanas recent highs. Such moves, while steep, arent uncommon during heavy altcoin corrections. With macro uncertainty and broad market weakness driving risk-off behavior, Solanas path forward will likely depend on whether bulls can reclaim key levels or if more downside is still to come. Solana Faces Critical Breakdown As Analysts Eye Deeper Correction Solana is now undergoing a crucial test as the price trades below $100 for the first time in over a year. Bulls are under pressure to reclaim key levels quickly in order to prevent further downside. However, the broader macroeconomic landscape paints a grim picture. Global markets remain rattled by escalating trade war tensions and policy uncertainty stemming from the U.S. and China, with financial conditions tightening across the board. For high-risk assets like Solana, the backdrop suggests the decline may still have room to continue. Pizzino has shared a bearish technical outlook that supports this view. He highlights the significance of Solanas repeated bearish signals using the 3-bar rule. The first warning appeared in November 2024, followed by another in January 2025. Now, with SOL firmly trading below $100, Pizzino believes the next targets lie at $80 and potentially sub-$60 a level that would represent an 80% correction from Solanas recent highs. While that may seem extreme, such pullbacks are not unusual in major altcoin cycles, particularly when driven by broader market panic. Related Reading: Ethereum Lags Behind Bitcoin In Q1 Performance Amid Market Downturn Details For Solana, the path forward hinges on whether bulls can reclaim momentum soon. A push back above the $110$120 zone could shift sentiment and delay deeper losses. Until then, the market remains on edge. Solana Bulls Fight to Avoid Further Losses Solana is currently trading at $100 after briefly dipping to $95 a price level not seen since February 2024. The sharp correction highlights the intense selling pressure that has taken hold of the market in recent weeks. As fear and uncertainty continue to dominate sentiment, SOL remains vulnerable to deeper losses if bulls fail to step in. The $100 level is now a psychological and technical battleground. While bulls are attempting to defend it, the broader market context shaped by global macroeconomic instability and weakening investor confidence suggests the recovery may face significant resistance. For Solana to regain momentum and signal a possible trend reversal, it must reclaim the $120 zone, which previously served as a key support level. Related Reading: Massive Chainlink Demand Wall At $6.26 As 90K Investors Buy 376M LINK However, selling pressure remains strong, and if SOL fails to hold the $100 threshold, a move into lower demand zones becomes increasingly likely. Analysts point to the $80 level as the next critical area where buyers may look to step in. Until then, price action remains fragile, and the downtrend could extend if broader market conditions fail to improve. For now, all eyes are on whether $100 can hold or break. Featured image from Dall-E, chart from TradingView
A quant has pointed out how a Bitcoin metric may have detected selling pressure in the market, and therefore, the subsequent price drops, in advance. Bitcoin CDD Registered Spikes Before Recent Price Plunges In a new post on X, an analyst has discussed about how the Coin Days Destroyed (CDD) on-chain indicator may be used to identify selling pressure in the market early. A “coin day” refers to the quantity that 1 BTC accumulates after staying still on the blockchain for 1 day. When a token stays dormant for a while, it naturally accumulates some number of coin days, and once it’s finally transferred on the network, its coin days counter resets back to zero. Related Reading: XRP Whales Are Active: Heres Where They Are Sending Coins The coin days that this token had been carrying prior to this movement are said to be “destroyed” by the transaction. The CDD keeps track of the total number of such days being reset across the network on any given day. Now, here is a chart that shows the trend in the CDD for Bitcoin over the last couple of months: The pattern that the indicator has followed alongside the BTC price in the past two months | Source: CryptoQuant As displayed in the above graph, the Bitcoin CDD observed a large spike just a few days ago. Whenever this metric’s value shoots up, it means that a large amount of coins previously dormant are now on the move. Such transfers are generally correlated with the long-term holder whales, who are large entities who carry their coins for significant periods, and thus, accumulate a large number of coin days. Often, when these dormant entities finally break their silence, it’s for selling-related purposes. As such, spikes in the CDD can be an indication that the HODLer whales have decided to do some selling. In the chart, the quant has highlighted the major spikes that the indicator observed during the last two months. It would appear that following the onset of such spikes, the asset’s price has generally gone on to witness some bearish action. The aforementioned spike from a few days ago, too, has proven to be bearish for the asset so far as it occurred when Bitcoin had recovered towards $67,000, and the price has since erased this recovery. It would appear that some of these diamond hands had looked at this surge as an exit opportunity. Related Reading: 85% Of Altcoins In Opportunity Zone, Santiment Reveals Last month, the CDD had seen two spikes even larger than this recent one. These spikes had occurred near what continues to be the top for the rally so far. Thus, the selling pressure from HODLers may have played a role in this top and the subsequent drawdown that followed. Given the relationship that this metric has appeared to have held with the Bitcoin price, it may be worth keeping an eye on it, as it may continue to indicate the onset of selling pressure in the near future as well. BTC Price Bitcoin has continued its bearish trajectory during the past day as it has now slipped towards the $62,300 level. Looks like the price of the coin has been going down over the last few days | Source: BTCUSD on TradingView Featured image from Kanchanara on Unsplash.com, CryptoQuant.com, chart from TradingView.com
The head of research at the on-chain analytics firm CryptoQuant has explained why selling pressure from Bitcoin traders may be declining. Bitcoin Short-Term Holder Realized Price Has Risen To $60,000 In a new post on X, CryptoQuant head of research Julio Moreno has discussed why the short-term holder selling pressure may be declining for BTC. [...]
The post Bitcoin Trader Selling Pressure Declining, CryptoQuant Head Explains Why appeared first on Crypto Breaking News.
Bitcoin has surged back above the $70,000 level during the past day despite the negative Net Taker Volume for the asset. Bitcoin Net Taker Volume Has Seen Some Large Negative Spikes Recently As explained by CryptoQuant Netherlands community manager Maartunn in a post on X, selling spikes of a significantly heavier scale than before have recently appeared in the Bitcoin Net Taker Volume. Related Reading: Bitcoin 2 Months Through Euphoria Wave, How Long Was The Last One? The “Net Taker Volume” is an indicator that keeps track of the difference between the Bitcoin taker buy and taker sell volumes in perpetual swaps. How can the sell and buy volumes be different? As CryptoQuant explains in its data guide: This concept is often confusing because every trade requires both a buyer and a seller of the given underlying asset. However, depending on whether the order taker is a buyer or seller (whether a transaction occurs at the ask price or the bid price), you can distinguish between long volume from taker seller volume. When the value of this metric is positive, it means that the taker buy volume is overwhelming the taker sell volume right now. Such a trend implies a bullish sentiment is shared by the majority. On the other hand, the negative indicator suggests that more sellers are willing to sell the coin at a lower price, a sign that a bearish mentality is the dominant one. Now, here is a chart that shows the trend in the Bitcoin Net Taker Volume over the past year: The value of the metric seems to have been quite red in recent days | Source: @JA_Maartun on X As the above graph shows, the Bitcoin Net Taker Volume has recently registered a sharp negative spike, implying that the taker sell volume has been higher than the taker buy volume. The Net Taker Volume has been seeing some large red spikes for a while, as the analyst highlighted in the chart. “Bitcoin is being hammered down massively, with selling spikes on the Net Taker Volume significantly heavier than before,” says Maartunn. Interestingly, despite this bearish sentiment in the market, the Bitcoin price has managed to hold up relatively well. Obviously, the coin’s bullish momentum has gone while these negative Net Taker Volume spikes have taken hold, but the fact that BTC has shown strength against any sustained drawdowns is still impressive. Related Reading: Dogecoin Slows Down: What Needs To Happen For New DOGE Highs? A pattern that’s perhaps visible in the chart is that although the Net Taker Volume has continued to see red spikes recently, their scale has gradually decreased. Thus, if this trend continues, it’s possible that the bearish mentality will eventually run out, and buying pressure will take over Bitcoin. It now remains to be seen how the indicator develops shortly. BTC Price Bitcoin declined below $68,000 just yesterday, but today, the asset has already bounced back and is now trading around $70,800. Looks like the price of the coin has made some recovery over the past 24 hours | Source: BTCUSD on TradingView Featured image from Jievani Weerasinghe on Unsplash.com, CryptoQuant.com, chart from TradingView.com
The Ethereum Foundation has announced April 12 as the date of deployment of the much-anticipated Shanghai and Capella upgrade, together dubbed as Shapella. The upgrades will enable withdrawals from Ethereum 2.0 staking contracts. The staking contract was first launched in December 2020. It only accepted one-way deposits of ETH, which will change after the upgrade. [...]
The post Analysts debate the ETH price outcomes of Ethereum’s upcoming Shapella upgrade appeared first on Crypto Breaking News.
Solana, a leading blockchain platform, recently implemented upgrades that aim to enhance its network’s performance and address concerns regarding congestion that were affecting the earnings of validators. The upgrades are designed to optimize the network’s capacity, improve transaction speeds, and alleviate bottlenecks that were impacting the overall efficiency of the Solana blockchain. By making these [...]
The post VanEck: Solana Network Upgrade Boosts Strength But Pressures Validators appeared first on Crypto Breaking News.
World Crypto Global opens the door to digital freedom for everyone.
Manage your free WCG Coins securely—where simplicity meets global accessibility.
FREE CRYPTO COINS
AVAILABLE FOR RESERVATION
ALREADY ALLOCATED

No fees. No catch. Your crypto journey starts here.