German govt was rushing to sell Bitcoin to maximize liquidity: Arkham CEO
Using five different crypto exchanges suggests that the wallet sought to maximize liquidity on each order book and sell Bitcoin as soon as possible.
Loading
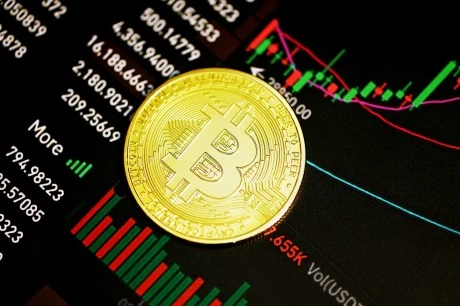
Welcome at World Crypto Global. This portal is packed with useful content and resources to built out your own crypto skills. WorldCrypto is a site member of Gabriel Vega Network.

Using five different crypto exchanges suggests that the wallet sought to maximize liquidity on each order book and sell Bitcoin as soon as possible.
On-chain data shows that Bitcoin long-term holders have potentially been selling recently, something that may explain BTC’s continued bearish momentum. Bitcoin Exchange Inflow CDD Has Registered Huge Spikes Recently As an analyst in a CryptoQuant Quicktake post explained, old cryptocurrency tokens have recently been deposited in large quantities in centralized exchanges. The on-chain metric of interest here is the “Exchange Inflow Coin Days Destroyed (CDD).” A “coin day” refers to a quantity that 1 BTC accumulates after staying dormant on the blockchain for 1 day. Related Reading: Bitcoin Crash Forced Weak Hands Into Largest Loss-Taking Since 2022 Lows: Report When a coin that had been sitting still inside a wallet is finally moved, its coin days counter naturally resets back to zero, and the coin days it had been carrying before the move are said to be “destroyed.” The CDD keeps track of the total amount of coin days being reset in this manner across the network. In the context of the current topic, though, the general CDD isn’t the one of focus, but rather the Exchange Inflow CDD, which only keeps track of the coin days being destroyed through transactions into wallets connected to exchanges. Now, here is a chart that shows the trend in the Bitcoin Exchange Inflow CDD over the past month or so: As is visible in the above graph, the Bitcoin Exchange Inflow CDD has registered some spikes of considerable scale this month. This would imply that many dormant coins have recently seen deposits into exchanges. Generally, spikes in the CDD correlate to movement from the long-term holders (LTHs), as these HODLers tend to accumulate large amounts of coin days. Therefore, the recent spikes in the Exchange Inflow CDD suggest that these diamond hands have been transferred to exchanges. Holders make transactions into exchanges when they want to use one of the services these platforms provide, which can include selling. The chart shows that the spikes earlier in the month had come when Bitcoin had plunged towards its lows, implying that the selling pressure from this cohort may have played a role in the crash. The latest spike, larger in scale than the others, has come while BTC has been trying to start a recovery rally from these recent lows. So far, BTC has had no luck, suggesting that the selling from the LTHs has potentially been holding the coin back. Related Reading: Chainlink Traders Capitulate After 10% Plunge: Bottom Here? It remains to be seen how the Exchange Inflow CDD behaves in the coming days and if any potential further spikes would impede Bitcoin in its path to recovery. BTC Price At the time of writing, Bitcoin is trading at around $57,900, up more than 4% over the past week. Featured image from Dall-E, CryptoQuant.com, chart from TradingView.com
Bitcoin outflows from the Mt. Gox exchange have occurred in the past day, making some worry about potential bearish effects. Heres what an analyst thinks. Mt. Gox Has Made Several Bitcoin Transactions In The Last 24 Hours During the past day, several movements from wallets associated with the bankrupt cryptocurrency exchange Mt. Gox have been [...]
The post Is Mt. Gox A Worry For Bitcoin? Crypto Analyst Weighs In appeared first on Crypto Breaking News.
The Bitcoin price recovery above the $67,000 level has triggered a round of selling, but it is not from the usual camp of large investors selling. This time around, it is the small-time traders who are offloading their bags and putting selling pressure on the price. However, this is not an entirely bad thing given that, historically, such selling has been bullish for the Bitcoin price. Bitcoin Retail Are Dumping Their Bags In a report on X (formerly Twitter), the on-chain data tracker Santiment revealed an interesting trend among small-time Bitcoin investors. As the price of Bitcoin rallied past $67,000 over the weekend, these small wallets took this as the time to sell and secure profit. Related Reading: Cardano Whales Return To The Table, Increase Massive Holdings By 10% These wallets are those holding below 0.1 BTC on their balances. This means that at the high end, these wallets are holding an average of $6,000. In the space of one week, Santiment notes that their collective holdings had dropped 0.46%. #Bitcoin is dancing just above $66.1K as small traders continue to #liquidate their holdings despite the #crypto bounce over the past week. Historically, small wallets dumping their coins to larger wallets is an encouraging and #bullish sign for $BTC. https://t.co/wlz4XPhfMD pic.twitter.com/dTJAy5G6pL Santiment (@santimentfeed) May 19, 2024 Selling among smaller wallets is not new, but at this level, it could have a significant impact on the price. However, compared to when whale and sharks sell their BTC holdings, retail investors selling is usually bullish for the price. This is because as the smaller traders sell, the BTC is picked up by the larger traders, who are usually longer-term holdings. As blockchain agency Crynet explains in a response to Santiment: While small traders divesting might seem concerning, it’s often a bullish signal. Historically, this redistribution to larger holders indicates stronger hands in the market. Let’s see how this plays out. Bullish Sentiment Rises Among Investors The selling by small Bitcoin traders comes amid a jump in bullishness. As Santiment reported in a previous post, bullishness among Bitcoin investors has now jumped to a 4-month high. The last time that investors were this bullish was back in January 2024 when the price of BTC had jumped above $45,000. Related Reading: Crypto Analysts Reveal Sub-$1 Altcoins Set To Outperform In The Bull Run Bitcoins weighted sentiment is now sitting at a value of 0.99, and although this is still lower than its January high of almost 1.8, it remains one of the highest among large caps. Currently, only the Chainlink (LINK) weighted sentiment is higher after rising to a new one-year high of 1.829. The crowd’s sentiment has shifted toward #Bitcoin after the surprise bounce above $66K Wednesday (and now above $67.2K). Additionally, #Chainlink is seeing its most #bullish sentiment in over a year. #FOMO staying low will help these rises continue. https://t.co/TcEPBdS9Oh pic.twitter.com/czvE1mOgId Santiment (@santimentfeed) May 17, 2024 The Ethereum weighted sentiment is currently sitting at a low -0.44, while XRP and Binances BNB are sitting at around -0.37. This suggests that bearishness continues to dominate among these assets while crypto investors look to Bitcoin to lead the market. At the time of writing, the BTC price is still trading at a high price of $66,900. The largest cryptocurrency by market cap is seeing a 6.78% increase in the last week and a small decline of 0.5% in the last day, according to data from Coinmarketcap. Featured image created using Dall.E, chart from Tradingview.com
A quant has pointed out how a Bitcoin metric may have detected selling pressure in the market, and therefore, the subsequent price drops, in advance. Bitcoin CDD Registered Spikes Before Recent Price Plunges In a new post on X, an analyst has discussed about how the Coin Days Destroyed (CDD) on-chain indicator may be used to identify selling pressure in the market early. A “coin day” refers to the quantity that 1 BTC accumulates after staying still on the blockchain for 1 day. When a token stays dormant for a while, it naturally accumulates some number of coin days, and once it’s finally transferred on the network, its coin days counter resets back to zero. Related Reading: XRP Whales Are Active: Heres Where They Are Sending Coins The coin days that this token had been carrying prior to this movement are said to be “destroyed” by the transaction. The CDD keeps track of the total number of such days being reset across the network on any given day. Now, here is a chart that shows the trend in the CDD for Bitcoin over the last couple of months: The pattern that the indicator has followed alongside the BTC price in the past two months | Source: CryptoQuant As displayed in the above graph, the Bitcoin CDD observed a large spike just a few days ago. Whenever this metric’s value shoots up, it means that a large amount of coins previously dormant are now on the move. Such transfers are generally correlated with the long-term holder whales, who are large entities who carry their coins for significant periods, and thus, accumulate a large number of coin days. Often, when these dormant entities finally break their silence, it’s for selling-related purposes. As such, spikes in the CDD can be an indication that the HODLer whales have decided to do some selling. In the chart, the quant has highlighted the major spikes that the indicator observed during the last two months. It would appear that following the onset of such spikes, the asset’s price has generally gone on to witness some bearish action. The aforementioned spike from a few days ago, too, has proven to be bearish for the asset so far as it occurred when Bitcoin had recovered towards $67,000, and the price has since erased this recovery. It would appear that some of these diamond hands had looked at this surge as an exit opportunity. Related Reading: 85% Of Altcoins In Opportunity Zone, Santiment Reveals Last month, the CDD had seen two spikes even larger than this recent one. These spikes had occurred near what continues to be the top for the rally so far. Thus, the selling pressure from HODLers may have played a role in this top and the subsequent drawdown that followed. Given the relationship that this metric has appeared to have held with the Bitcoin price, it may be worth keeping an eye on it, as it may continue to indicate the onset of selling pressure in the near future as well. BTC Price Bitcoin has continued its bearish trajectory during the past day as it has now slipped towards the $62,300 level. Looks like the price of the coin has been going down over the last few days | Source: BTCUSD on TradingView Featured image from Kanchanara on Unsplash.com, CryptoQuant.com, chart from TradingView.com
On-chain data shows Bitcoin miners have always sold as Halvings have occurred. With the next one just around the corner, how are miners behaving this time? Next Bitcoin Halving Is Less Than Two Days Away Now In a CryptoQuant Quicktake post, an analyst discussed Bitcoin miners behavior in the build-up to the next Halving. The [...]
The post Bitcoin Miners Always Sell Into Halvings, Is This Time Any Different? appeared first on Crypto Breaking News.
The head of research at the on-chain analytics firm CryptoQuant has explained why selling pressure from Bitcoin traders may be declining. Bitcoin Short-Term Holder Realized Price Has Risen To $60,000 In a new post on X, CryptoQuant head of research Julio Moreno has discussed why the short-term holder selling pressure may be declining for BTC. [...]
The post Bitcoin Trader Selling Pressure Declining, CryptoQuant Head Explains Why appeared first on Crypto Breaking News.
On-chain data suggests the Bitcoin whales have been showing different behavior regarding exchange inflows from the last cycle. Heres why this may be so. Bitcoin Whales Are Showing Different Behavior In Exchange Inflows This Time As an analyst explained in a CryptoQuant Quicktake post, the BTC whales movements have been different this time compared to [...]
The post Bitcoin Whales Showing Different Behavior From Past Cycles, But Why? appeared first on Crypto Breaking News.
Bitcoin has surged back above the $70,000 level during the past day despite the negative Net Taker Volume for the asset. Bitcoin Net Taker Volume Has Seen Some Large Negative Spikes Recently As explained by CryptoQuant Netherlands community manager Maartunn in a post on X, selling spikes of a significantly heavier scale than before have recently appeared in the Bitcoin Net Taker Volume. Related Reading: Bitcoin 2 Months Through Euphoria Wave, How Long Was The Last One? The “Net Taker Volume” is an indicator that keeps track of the difference between the Bitcoin taker buy and taker sell volumes in perpetual swaps. How can the sell and buy volumes be different? As CryptoQuant explains in its data guide: This concept is often confusing because every trade requires both a buyer and a seller of the given underlying asset. However, depending on whether the order taker is a buyer or seller (whether a transaction occurs at the ask price or the bid price), you can distinguish between long volume from taker seller volume. When the value of this metric is positive, it means that the taker buy volume is overwhelming the taker sell volume right now. Such a trend implies a bullish sentiment is shared by the majority. On the other hand, the negative indicator suggests that more sellers are willing to sell the coin at a lower price, a sign that a bearish mentality is the dominant one. Now, here is a chart that shows the trend in the Bitcoin Net Taker Volume over the past year: The value of the metric seems to have been quite red in recent days | Source: @JA_Maartun on X As the above graph shows, the Bitcoin Net Taker Volume has recently registered a sharp negative spike, implying that the taker sell volume has been higher than the taker buy volume. The Net Taker Volume has been seeing some large red spikes for a while, as the analyst highlighted in the chart. “Bitcoin is being hammered down massively, with selling spikes on the Net Taker Volume significantly heavier than before,” says Maartunn. Interestingly, despite this bearish sentiment in the market, the Bitcoin price has managed to hold up relatively well. Obviously, the coin’s bullish momentum has gone while these negative Net Taker Volume spikes have taken hold, but the fact that BTC has shown strength against any sustained drawdowns is still impressive. Related Reading: Dogecoin Slows Down: What Needs To Happen For New DOGE Highs? A pattern that’s perhaps visible in the chart is that although the Net Taker Volume has continued to see red spikes recently, their scale has gradually decreased. Thus, if this trend continues, it’s possible that the bearish mentality will eventually run out, and buying pressure will take over Bitcoin. It now remains to be seen how the indicator develops shortly. BTC Price Bitcoin declined below $68,000 just yesterday, but today, the asset has already bounced back and is now trading around $70,800. Looks like the price of the coin has made some recovery over the past 24 hours | Source: BTCUSD on TradingView Featured image from Jievani Weerasinghe on Unsplash.com, CryptoQuant.com, chart from TradingView.com
An analyst has revealed a simple strategy for buying and selling Bitcoin using the historical pattern followed by two BTC on-chain indicators. These Bitcoin On-Chain Indicators Have Followed A Specific Pattern Historically In a post on X, CryptoQuant author Axel Adler Jr. discussed a simple strategy for timing buying and selling moves for Bitcoin. The [...]
The post Whats A Simple Strategy For Buying & Selling Bitcoin? This Analyst Answers appeared first on Crypto Breaking News.
On-chain data shows the Bitcoin “Liquid Inventory Ratio” has dropped to an all-time low. Here’s what this could mean for the asset. Bitcoin Sell Side Liquidity Is Low Relative To Demand Right Now In a post on X, CryptoQuant founder and CEO Ki Young Ju discussed the recent trend in the Liquid Inventory Ratio for Bitcoin. The Liquid Inventory Ratio is an on-chain indicator that tells us about how the total sell-side liquidity inventory of the asset compares against its demand. Related Reading: Bitcoin Sentiment Returns To Extreme Greed As BTC Breaks $71,000 The sell-side liquidity inventory of the asset is gauged using four factors: the total exchange reserve, miner holdings, OTC desk holdings, and US government-seized BTC. Out of these, the exchange reserve (that is, the total amount sitting in the wallets of centralized exchanges) is the largest potential source of sell-side liquidity. The chart on the right below shows how the sell-side liquidity inventory of the coin has changed over the last few years: The value of the metric appears to have been going down in recent years | Source: ki_young_ju on X From the graph, it’s visible that the sell-side liquidity of the cryptocurrency has been heading down for a while now. This decline is mostly driven by the depletion of exchange reserves, as investors have been continuously pushing towards self-custody, possibly preferring to hold onto their Bitcoin for extended periods. The chart on the left displays the trend in the total demand for the asset. Here, the demand is measured using the 30-day balance changes of “accumulation addresses.” The accumulation addresses are those that have a history of only buying BTC and no history of selling. Exchanges and miner entities are excluded from this cohort, of course, as they count under the sell-side liquidity instead, regardless of whether they satisfy the condition for accumulation addresses or not. Clearly, the demand for Bitcoin has exploded recently as new players like exchange-traded funds (ETFs) have entered into the arena. All this BTC is potentially going out of circulation and being locked into the wallets known for hosting a one-way traffic. Given these two developments in the sell-side liquidity inventory and demand, it’s not surprising to see that the Liquid Inventory Ratio, which measures the ratio between the two, has plunged recently. The trend in the Liquid Inventory Ratio for the asset over the past few years | Source: ki_young_ju on X Following the latest decline in the indicator, its value has, in fact, dropped to a new all-time low. This means that the sell-side liquidity has never been this low when compared to the demand for Bitcoin. Related Reading: Bitcoin Coinbase Premium Returns To Neutral: Buying Push Already Over? Given this trend, it will be interesting to see how the BTC rally plays out from here, as the supply available to buy is only continuing to tighten. BTC Price Bitcoin had seen some drawdown earlier, but bullish winds have seemingly returned for the coin as its price has now recovered back above $70,200. Looks like the price of the asset has enjoyed a sharp surge over the last few days | Source: BTCUSD on TradingView Featured image from Shutterstock.com, CryptoQuant.com, chart from TradingView.com
On-chain data shows that Bitcoin miners have transferred many coins to exchanges today, which may be a sign of selling. Bitcoin Miner To Exchange Flow Has Observed A Huge Spike Today As pointed out by an analyst in a CryptoQuant post, a total of 1,637 BTC was deposited to exchanges by the miners today. There [...]
The post Bitcoin Miners Transfer Large Amount To Exchanges, Sign Of Selling? appeared first on Crypto Breaking News.
On-chain data suggests a majority of the Bitcoin exchange inflows are currently coming from investors holding their coins at a loss. Bitcoin Exchange Inflow Volume Is Tending Towards Losses Right Now According to data from the on-chain analytics firm Glassnode, the short-term holders are mostly contributing to these loss inflows. The “exchange inflow” is an indicator that measures the total amount of Bitcoin that’s currently flowing into the wallets of centralized exchanges. Generally, investors deposit to these platforms whenever want to sell, so a large amount of inflows can be a sign that a selloff is going on in the BTC market right now. Low values of the metric, on the other hand, imply holders may not be participating in much selling at the moment, which can be bullish for the price. In the context of the current discussion, the exchange inflow itself isn’t of relevance; a related metric called the “exchange inflow volume profit/loss bias” is. As this indicator’s name already suggests, it tells us whether the inflows going to exchanges are coming from profit or loss holders currently. When this metric has a value greater than 1, it means the majority of the inflow volume contains coins that their holders had been carrying at a profit. Similarly, values under the threshold imply a dominance of the loss volume. Related Reading: Bitcoin Hangs At $26,200: Why This Is A Crucial Support Level Now, here is a chart that shows the trend in the Bitcoin exchange inflow profit/loss bias over the last few years: The value of the metric seems to have observed some decline in recent days | Source: Glassnode on Twitter As shown in the above graph, the Bitcoin exchange inflow volume profit/loss bias has had a value above 1 for most of the ongoing rallies that started back in January of this year. This suggests that most of the exchange inflows in this period have come from the profit holders. This naturally makes sense, as any rally generally entices a large number of holders to sell and harvest their gains. Related Reading: Bitcoin Bearish Signal: NUPL Finds Rejection At Long-Term Resistance There have been a couple of exceptional instances, however. The first was back in March when the asset’s price plunged below the $20,000 level. The bias in the market shifted towards loss selling then, implying that some investors who bought around the local top had started capitulating. A similar pattern has also occurred recently, as the cryptocurrency’s price has stumbled below the $27,000 level. Following this plunge, the indicator’s value has come down to just 0.70. Further data from Glassnode reveals that the bias of the long-term holders (LTHs), the investors holding their coins since at least 155 days ago, have actually leaned towards profits recently. Looks like the indicator has a positive value right now | Source: Glassnode on Twitter From the chart, it’s visible that the indicator has a value of 1.73 for the LTHs, implying a strong bias toward profits. Naturally, if the LTHs haven’t been selling at a loss, the opposite cohort must be the short-term holders (STHs). This group seems to have a heavy loss bias currently | Source: Glassnode on Twitter Interestingly, the indicator’s value for the STHs is 0.69, which is almost exactly the same as the average for the entire market. This would mean that the LTHs have contributed relatively little to selling pressure recently. The STHs selling right now would be the ones that bought at and near the top of the rally so far and their capitulation may be a sign that these weak hands are currently being cleansed from the market. Although the indicator hasn’t dipped as low as in March yet, this capitulation could be a sign that a local bottom may be near for Bitcoin. BTC Price At the time of writing, Bitcoin is trading around $26,400, down 1% in the last week. BTC has struggled recently | Source: BTCUSD on TradingView Featured image from ???? cdd20 on Unsplash.com, charts from TradingView.com, Glassnode.com
On-chain data shows the Bitcoin sell-side risk ratio has approached all-time lows recently, a sign that a big move could be coming for the coin. Bitcoin Sell-Side Risk Ratio Has Observed A Plunge Recently As pointed out by the lead on-chain analyst at Glassnode in a Tweet, BTC sellers may have become exhausted recently. The [...]
The post Bitcoin Sell-Side Risk Ratio Nears All-Time Lows, Big Move Soon? appeared first on Crypto Breaking News.
Bitcoin has set a new all-time high (ATH) beyond the $104,000 mark during the past day, but on-chain data shows investors are still unwilling to sell. Bitcoin Exchange Netflow Has Remained Negative During Latest Rally As explained by an analyst in a CryptoQuant Quicktake post, Bitcoin has continued to leave exchanges recently. The on-chain metric of relevance here is the “Exchange Netflow,” which, as its name suggests, keeps track of the net amount of BTC that’s entering into or exiting out of the wallets attached to centralized platforms. Related Reading: Bitcoin 30-Day Trader Profits Back In Healthy Range, Is BTC Ready For $100,000? When the value of this metric is positive, it means the investors are making net deposits to the exchanges. As one of the main reasons why holders use these platforms is for selling-related purposes, this kind of trend can have a bearish implication for BTC. On the other hand, the indicator being negative implies there are a higher amount of exchange outflows happening than inflows. Such a trend can be a sign that the investors want to hold onto their coins into the long-term, which is something that can naturally be bullish for the asset’s price. Now, here is a chart that shows the trend in the Bitcoin Exchange Netflow over the last couple of years: As displayed in the above graph, the Bitcoin Exchange Netflow has observed significant negative spikes during the last month or so, suggesting some large withdrawals have occurred. This net outflow spree has come even though the cryptocurrency has observed a massive run to new ATHs. The chart shows that this wasn’t the case during the rally in the first quarter of this year. Outflows were happening back then for sure, but there were also notable net inflow spikes between them, implying that demand was present for selling the asset. The recent negative Exchange Netflow has maintained for Bitcoin through the latest rally beyond $100,000, a sign that investors are still unwilling to part with their BTC even at these high prices. Related Reading: Ethereum To $10,000: Analyst Reveals Mid & Long-Term ETH Targets If this trend continues, it’s possible that this run could still have more room to run. However, it remains to be seen how long holders can stay quiet. Generally, the higher the investor profits, the more likely they become to participate in a mass selloff. So, with Bitcoin continuing to perform well, it may only be a matter of time before a large profit-taking spree arrives. BTC Price Bitcoin has finally broken free of its recent consolidation phase with a more than 7% surge during the last 24 hours. The asset briefly broke above the $104,000 mark in this rally, but its price has since seen a minor pullback to $103,500. Featured image from Dall-E, CryptoQuant.com, chart from TradingView.com
Bitcoin faced a sharp retrace yesterday, dropping 8% from its all-time high of $108,300 after the Federal Reserve announced a 25 basis point rate cut alongside a revised policy signaling fewer cuts in 2025. Despite the drop, Bitcoin managed to hold above $98,000, a critical liquidity level that analysts are closely monitoring. Related Reading: On-Chain Metrics Reveal Cardano Whales Are Buying The Dip Details This recent price action raises a pivotal question: is this the start of a more significant correction or merely a shakeout to fuel the next leg of Bitcoin’s rally? CryptoQuant analyst Axel Adler provided key insights, noting that no substantial panic selling is evident in the marketa signal that investor confidence remains intact for now. Bitcoin’s resilience at current levels suggests the market is recalibrating following the Feds latest moves. As traders and investors digest these developments, all eyes are on whether Bitcoin can recover momentum and push back toward its previous highs or if deeper retracements are on the horizon. With market sentiment hanging in the balance, the coming days will be crucial in determining Bitcoin’s next direction. Bitcoin Remains Strong Despite the recent dip and a noticeable shift in market sentiment, Bitcoin remains resilient above key liquidity levels, maintaining its long-term bullish structure. The price drop, sparked by broader market reactions to the Federal Reserves policy announcement, has raised concerns, but Bitcoin’s ability to hold critical support underscores its underlying strength. Top CryptoQuant analyst Axel Adler recently shared data on X, shedding light on the market’s current dynamics. According to Adler, no significant panic selling is evident, even after Bitcoin’s sharp decline. He highlighted a chart tracking the BTC short-term holder profit-loss to exchanges, revealing that this metric is currently at a higher level than seen during early December selling events. This indicates that the recent sell-off may have been less driven by fear and more of a strategic shakeout. This shakeout could serve to generate liquidity and provide the necessary momentum for Bitcoins ongoing rally. However, he also cautions that this could mark the beginning of a broader correction that might take time to fully develop. Related Reading: Solana Bull Flag Signals A Breakout To $300 Analyst Shares Key Levels The coming weeks will be pivotal for Bitcoin. As the market stabilizes, traders and investors are watching whether Bitcoin can reclaim higher levels or if further downside consolidation is on the cards. Price Action: Technical Levels To Hold Bitcoin is currently trading at $101,800, following a successful test of local demand at $98,695 earlier today. The price structure remains intact, with Bitcoin forming a clear pattern of higher highs and higher lows, signaling sustained bullish momentum. Despite the recent volatility, the market sentiment continues to lean optimistic as BTC holds above critical support levels. For Bitcoin to maintain its upward trajectory, a decisive push above $103,600 is essential. This level served as a significant pivot last week, marking a key zone for both buyers and sellers. Breaking through this resistance would likely signal renewed momentum, setting the stage for further gains as Bitcoin eyes new highs. However, failure to break above $103,600 could lead to a shift in sentiment. If BTC also loses the $100,000 psychological level, it would likely confirm the start of a broader correction. Such a scenario could drive the price toward lower support zones as the market recalibrates. Related Reading: Ethereum Whales Load Up: Bullish Sign Or Bear Trap? The next few days will be crucial in determining Bitcoins near-term direction. Traders are closely watching the $103,600 resistance and $100,000 support levels, as these thresholds will dictate whether BTC continues its rally or enters a corrective phase. Featured image from Dall-E, chart from TradingView
On-chain data shows the Bitcoin long-term holders are selling. Here’s whether the current level of selloff is enough for a price top or not. Bitcoin Long-Term Holders Have Been Selling Big Recently In a new post on X, analyst Ali Martinez has discussed about the historical trend in the holdings of the long-term holders relative to the Bitcoin top. The “long-term holders” (LTHs) refer to the BTC investors who have been holding onto their coins for more than 155 days. The LTHs represent one of the two main divisions of the BTC market done on the basis of holding time, with the other group being known as the short-term holders (STHs). Related Reading: Bitcoin Miners Now In Selling Mode For A Year: Should You Be Concerned? Historically, the latter cohort has proven to contain the weak hands of the market, while the former is made up of the HODLers who barely react to rallies and crashes in the price. As such, selling from the STHs is usually not of any note, but that from the LTHs can be, as it’s not a particularly common event. One way to keep track of the behavior of the diamond hands is through their Net Position Change. The Net Position Change is an on-chain metric that measures the total amount of Bitcoin entering into or exiting out of the LTH cohort. Below is the chart for the indicator shared by the analyst that shows the trend in its value over the history of the cryptocurrency. As displayed in the above graph, the Bitcoin LTH Net Position Change has witnessed a sharp decline into the negative territory in recent weeks, which implies a net amount of supply has been leaving the cohort. This isn’t the first time this year that the indicator has shown this trend, as something similar was also observed back during the first quarter of this year. In the chart, Martinez has highlighted this and the other older instances of this trend occurring. It would seem that the major selloffs from the LTHs have generally coincided with some sort of top in the cryptocurrency. “Interestingly, in 2017 and 2021, their biggest sell-offs occurred right before the final leg up,” notes the analyst. Related Reading: Bitcoin Derivatives Market Heating Up Again: Brace For Impact? Thus, if the current bull market is going to show anything similar, then it’s possible that the current LTH selloff may in fact only be the start of that final leg up that’s going to lead to the cyclical top for Bitcoin. The indicator is also currently not as negative as during the largest red spikes of the 2017 and 2021 bull runs, which could be another indication that the top isn’t in just yet. It only remains to be seen, though, whether the same pattern would repeat this time as well or not. BTC Price Bitcoin is back in all-time high (ATH) discovery mode as its price has just set a new record above the $107,000 milestone. Featured image from Dall-E, Glassnode.com, chart from TradingView.com
On-chain data shows that Bitcoin miners have been selling for around a year now. Here’s how much they have sold so far. Bitcoin Miners Have Shed Over 4% Of Their Holdings In Past Year As pointed out by CryptoQuant community analyst Maartunn in a new post on X, the BTC miners have been in net selling mode for a significant period of time. The on-chain metric of relevance here is the “miner reserve,” which keeps track of the total amount of coins that the miners as a whole are carrying in their wallets right now. Related Reading: Bitcoin Derivatives Market Heating Up Again: Brace For Impact? When the value of this indicator rises, it means the chain validators are adding a net number of tokens to their combined holdings. Such a trend can be a sign that this cohort is accumulating, which can naturally be bullish for the asset’s price. On the other hand, the metric observing a decline suggests the miners are withdrawing coins from their addresses. The main reason why this group makes such transactions is for selling-related purposes, so this kind of trend can have a bearish impact on BTC. Now, here is a chart that shows the trend in the Bitcoin miner reserve over the past year: As displayed in the above graph, the Bitcoin miner reserve has gone through a steady downtrend during this window. There have been some brief periods of deviation, but the overall trajectory has remained toward the downside. Historically, the miners have had a presence as consistent sellers on the network. The reason behind this is the fact that these chain validators have constant running costs in the form of electricity bills, which they pay off by selling their BTC rewards for fiat. Generally, though, despite being regular sellers, miners don’t pose too much of a threat to the price, as their selling tends to be of a scale that can readily be absorbed by the market. That said, the times that they do participate in a major selloff can be to watch out for. During the start of this year, the Bitcoin miners held a total of 1.99 million BTC in their reserve. Today, the same metric stands at 1.90 million BTC, implying the miners have sold 90,000 BTC (about $9.3 billion at the current exchange rate) or 4.74% of their holdings. Related Reading: Bitcoin Returns Above $100,000 As Monthly Inflows Hit $80 Billion This is a notable amount on its own, but when considering the context that this selling has come over some length of time rather than inside a narrow window, the selloff stops being too interesting. “Miners are offloading steadily, but not in large amounts,” notes the analyst. “This suggests they are likely selling to cover operational costs.” As such, it’s possible that Bitcoin wouldn’t feel any major bearish effects from this miner selloff. The miner reserve could still be to keep an eye on in the near future, however, as any sharp changes in the metric could potentially spell a new outcome for Bitcoin. BTC Price Bitcoin set a new all-time high beyond the $106,000 mark earlier in the day, but the coin appears to have seen a pullback since then as it’s now trading around $104,000. Featured image from Dall-E, IntoTheBlock.com, chart from TradingView.com
Bitcoin has plunged below the $27,000 mark during the past day. Here are the market segments that are possibly participating in this selloff. These Bitcoin Investors Have Been Spending Their Coins Recently In a new tweet, the on-chain analytics firm Glassnode has broken down the prices at which the average coins sold today were bought. [...]
The post Bitcoin Plunges Below $27,000, Which Holder Groups Are Selling? appeared first on Crypto Breaking News.
After a historic rally, Bitcoin has faced its first major setback, pulling back 7% from its all-time high of $99,800. This comes after an impressive surge from $67,500 on November 5, marking a nearly 50% climb in just a few weeks. The price action has largely been “only up,” attracting significant attention from traders and investors alike. Related Reading: Ethereum Analyst Predicts $3,700 Once ETH Breaks Through Resistance However, the current pullback highlights growing caution in the market. Market caution said leverage levels remain elevated despite recent deleveraging efforts. Adler’s analysis reveals that increasing short positions and consolidation below the psychological $100,000 mark have contributed to the retracement. While Bitcoin’s performance remains strong in the broader context, this dip signals a potential shift in market sentiment. The question is whether BTC can gather enough momentum to break past the $100,000 barrier or if further consolidation is on the horizon. Many investors consider this pullback a healthy pause in a bullish cycle, but the high leverage levels suggest continued volatility. All eyes are on Bitcoin as it navigates this critical phase, with the next few days likely to determine its short-term direction. Bitcoin Bears Showing Up After three weeks of minimal resistance from bears, signs of their resurgence emerge as Bitcoin struggles to break past the $100,000 level. This critical price point, which many believed would act as a springboard for further gains, has instead highlighted growing bearish sentiment. According to CryptoQuant analyst Axel Adler, the recent price action marks a potential shift in momentum. Adlers analysis on X reveals that despite a wave of recent deleveraging, leverage levels in the market remain elevated. Many key long positions were established around the $93,000 mark, providing bears with an opportunity to profit as BTC failed to push higher. This level has now become a battleground, with Bitcoin’s inability to sustain upward momentum signaling the possibility of further downside risk. Bitcoins price hovers around this key level, raising the likelihood of a correction toward $88,500 or prolonged sideways consolidation below $100,000. Such a scenario would impact Bitcoin and set the tone for altcoin performance in the coming weeks. Related Reading: XRP Analyst Sets $2 Target If It Holds Key Level Can It Reach Multi-Year Highs? The next two weeks will be pivotal as market participants closely watch Bitcoins price action. A decisive move, whether up or down, will shape the broader cryptocurrency landscape and determine whether this is merely a pause in a larger rally or the start of a deeper correction. BTC Testing Fresh Demand Bitcoin is trading at $93,500 as bears regained control after it hit an all-time high last Friday. This retracement marks a shift in momentum, but bulls still can reclaim dominance if the price remains strong above the critical $92,000 support level. Holding this level would keep Bitcoin’s price action structurally bullish and signal resilience in the face of increased selling pressure. If Bitcoin sustains strength above $92,000, the outlook for the short term remains optimistic, with the potential for another attempt at breaking key resistance levels. However, a drop below this mark would signal short-term weakness, potentially triggering further declines. The next critical level to watch would be around $84,000, where the 4-hour 200 EMA aligns as a support zone. This level represents a major line in the sand for bulls. A breakdown below it could accelerate bearish momentum, extending the correction and dampening market sentiment. On the other hand, holding above $92,000 would reinforce bullish confidence, setting the stage for a recovery and a potential pushback toward previous highs. Related Reading: Avalanche Soars 20% In 24 Hours Analyst Reveals Next Price Target Traders and investors are closely watching these levels, as Bitcoins ability to stay above $92,000 will determine whether it remains in a short-term bullish structure or succumbs to bearish pressures. Featured image from Dall-E, chart from TradingView
World Crypto Global opens the door to digital freedom for everyone.
Manage your free WCG Coins securely—where simplicity meets global accessibility.
FREE CRYPTO COINS
AVAILABLE FOR RESERVATION
ALREADY ALLOCATED

No fees. No catch. Your crypto journey starts here.