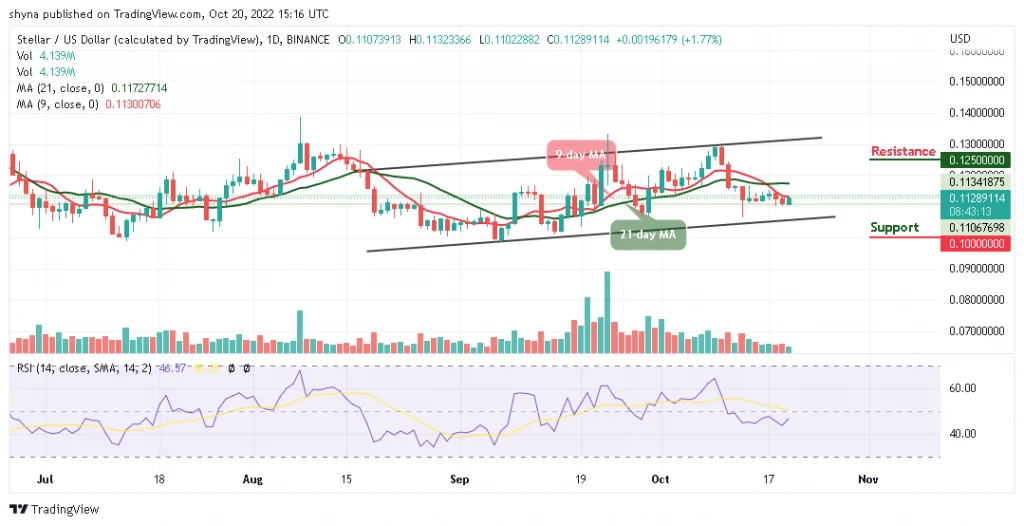
Stellar Price Prediction for Today, August 13 XLM Technical Analysis
The Stellar price prediction shows that XLM couldn’t break above the 21-day moving average after touching the daily high at $0.100. Stellar Prediction Statistics Data: [...]
Loading
Welcome at World Crypto Global. This portal is packed with useful content and resources to built out your own crypto skills. WorldCrypto is a site member of Gabriel Vega Network.

The Stellar price prediction shows that XLM couldn’t break above the 21-day moving average after touching the daily high at $0.100. Stellar Prediction Statistics Data: [...]
After breaking out of its five-month downtrend, an analyst suggests a repeat of Stellar (XLM)s last cycle playbook could be on the horizon. The cryptocurrency has confirmed its breakdown from a bullish reversal pattern and eyes a surge toward new targets Related Reading: Ethereum Jumps To $2,000 Amid Market Surge Analyst Says This Resistance Is Next Stellar Breakout Targets $0.39 Amid the market pump, Stellar has broken out of a key demand zone and retested the $0.30 mark for the first time since March. The cryptocurrency has been in a downtrend since its November 2024 breakout, when it reached a three-year high of $0.63. During this years retraces, XLM dropped 68% from the highs to a five-month low of $0.20. However, the late-April market recovery saw the cryptocurrency surge above the downtrend and attempt to confirm the breakout after recording a weekly close above the $0.28 mark. On Friday, Stellar has reclaimed the $0.29 resistance and retested the $0.30 mark for the first time in nearly two months. Following todays performance, Ali Martinez pointed out that Stellar is breaking out of a two-month inverse head and Shoulder pattern. This pattern is a bullish reversal setup that suggests a potential shift from a downtrend to an uptrend. Earlier this week, the analyst pointed out that the patterns right shoulder was forming and the neckline sat around the $0.29 mark. According to his post, a breakout from this formation potentially eyed a 30% rally toward the $0.39 resistance, lost during the February retraces. XLM To Repeat Historical Tendencies? Analyst Rekt Capital highlighted that the cryptocurrency confirmed the end of its multi-month downtrend and a breakout from its Downtrending Channel. Per the post, if XLM weekly closes above its key area, between $0.27-$0.29, any dips into this zone would figure as a successful reclaim of the area as support to support a move to higher regions. The analyst explained that reclaiming the $0.27-$0.29 area is crucial because it is a historical demand region on the monthly timeframe. In the past, turning this zone into support during bull markets has enabled Stellar to rally toward the $0.37-$0.40 mark. In 2021, the cryptocurrency rallied toward its cycle high of $0.80 after retesting the key demand zone and breaking out of the $0.37 barrier. Similarly, it hit its all-time high (ATH) of $0.87 after a breakout from this area. Related Reading: Crypto Analyst Says XRP Price Must Clear This Level Or Risk Crash To $1.9 If XLM repeats history and rallies to the next resistance, it must reclaim and confirm that level to continue with its historical tendencies. As such, a reclaim could see XLM challenge the $0.52 blue highs over time, Rekt Capital concluded. Meanwhile, analyst CW has noted that after breaking the upper line of the downtrend channel, Stellar would encounter resistance in two selling walls, one between the $0.34-$0.38 levels, and a big one around the $0.47-$0.70 zone. As of this writing, Stellar trades at $0.296, a 2% increase in the daily timeframe. Featured Image from Unsplash.com, Chart from TradingView.com
The Stellar price prediction is recovering from the daily opening price at the $0.112 level as the price begins the upward movement. Navigating Obstacles: Stellar [...]
The Stellar price has crashed by double digits over the past week, mirroring the dwindling climate of the altcoin market. However, if the latest price action is anything to go by, XLM could be gearing up for a significant bullish rally in the coming days. Heres How XLM Is Gearing For A 20% Move In a new post on the X platform, prominent crypto analyst Ali Martinez put forward an interesting prognosis for the Stellar price over the next few days. According to Martinez, the price of XLM could experience some relief soon, as a 20% upward move appears to be on the horizon. Related Reading: Bitcoin Price Forecast: LTF Head And Shoulders Pattern Predicts Crash Heres The Target The reasoning behind this bullish projection is the formation of a descending triangle pattern on the 1-hour timeframe of the Stellar price chart. The descending triangle is a technical analysis pattern that looks like a right-angled triangle with a diagonal falling upper trendline (connecting a series of lower highs) and a horizontal lower trendline (connecting the swing lows). Typically, a descending triangle formation is considered a bearish technical analysis pattern or a continuation pattern with an established downtrend. Nevertheless, a descending triangle can also be a trend reversal pattern and a bullish signal, with the price breaking out in the initial trends opposite direction. As shown in the chart above, the price of Stellar recently found support at the horizontal lower trendline set around $0.274, bouncing back toward the $0.28 mark. However, Martinez suggested that the XLM price could be targeting the resistance zone between $0.28 and $0.29. If the Stellar price does break out of the descending triangle pattern, Martinez expects the altcoin to move up by at least 20%, placing the target at around $0.33. For context, the price target for the descending triangle pattern is calculated by adding the vertical height between the sloping and horizontal trendlines. A move toward $0.33 could be exactly what the price of Stellar needs to kickstart a fresh bull rally. In a separate post on X, Martinez revealed that the $0.55 mark might be a crucial level to watch for a sustained bull run. The chart above shows that the price of XLM has been rejected at $0.55 level multiple since 2018. However, it is worth noting that the more times the price tests a level, the weaker it becomes and the more likely it is to be broken. Stellar Price At A Glance As of this writing, the price of XLM stands at around $0.276, reflecting a 1.6% decline in the past 24 hours. According to data from CoinGecko, the altcoins value has fallen by more than 11% in the past seven days. Related Reading: AAVE Price To $360? Crypto Analyst Identifies Pattern For Bullish Breakout Featured image from Adobe Stock, chart from TradingView
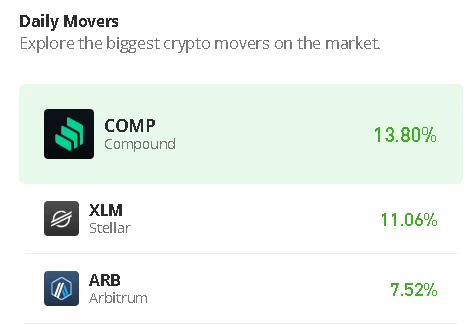
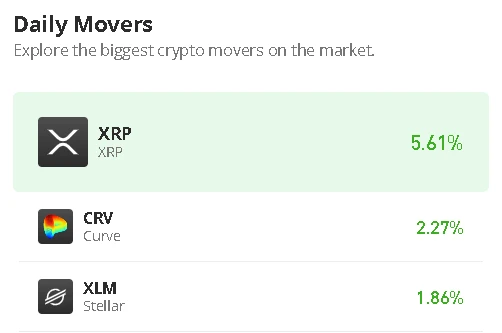
The other notable gainers over the past 24 hours include HBAR, NEAR, and XRP.
The Stellar (XLM) market has registered a price boost in the past day gaining by 10.77% according to data from CoinMarketCap. This price bounce comes after a rather bearish week marked by significant losses across the general crypto market. Interestingly, as these digital assets show some minor recovery, renowned market analyst Ali Martinez has postulated that XLM may be preparing for a major bullish swing. Related Reading: Solana Jumps 9% As Whales Quietly Accumulate MillionsDetails XLMs Bullish Flag Could Propel Prices To $1.20 – Analyst In an X post on March 1, Martinez shared an interesting technical analysis of the XLM market. According to the market expert, there is a bullish flag formation on the XLM/USDT 3-day trading chart signaling an incoming price surge. For context, the bullish flag pattern occurs when an asset experiences a steep rise in price representing the flagpole followed by a consolidation period with a declining price movement representing the flag. On the XLM/USDT chart, the bullish flag is formed following a price rally in November 2024 which is trailed by a price correction phase to date. However, while the bullish flag might signal a potential upward momentum ready to explode, Stellar must break beyond the upper boundary of the flag currently at $0.41 to confirm any price surge. Looking beyond this level, the altcoin will also face significant resistance to its upward movement at $1.00, $1.21, and $1.41 price levels respectively. However, in the presence of sufficient buying pressure, XLM could surge by at least 330% upon confirmation of bullish intent suggesting a minimum price of around $1.20. This projected rise of Stellar stems from historical data from which a bullish flag is expected to produce market gains similar to the length of its flagpole. Interestingly, the Relative Strength Index (RSI) on the XLM/USDT daily chart also supports the bullish potential of the altcoin. According to data from Tradingview, this RSI is currently at 4.59 headed in the upward direction, signaling more room for XLM price gains following its recent recovery. Related Reading: Dogecoin Holds Critical Support Level Can Bulls Reclaim $0.25? XLM Price Overview At the time of writing, XLM trades at $0.3141 after its 10% price increase in the last 24 hours as earlier stated. Meanwhile, there is a slight reduction in market engagement as indicated by a 1.12% decline in daily trading volume. It is worth noting that XLM still remains in the red zone on its weekly and monthly timeframes with losses of 5.94% and 27.28%, respectively suggesting larger bearish market control in recent times. For a bullish flag breakout to materialize, XLM traders must increase the current buying pressure and induce a higher trading volume. Featured image from Bitpanda, chart from Tradingview
After a turbulent start to the week, the Stellar price seems to be finding some stability, briefly climbing above the $0.28 level this weekend. This growing momentum has sparked interest from market enthusiasts, with prominent crypto analyst Ali Martinez projecting the XLM token to soon experience a sustained price rise. Related Reading: Bitcoin Price Breaking Out Of This Pattern Can BTC Reclaim $90,000? XLM Primed For 40% Price Gain In an X post on March 15, Martinez shared an intriguing projection for Stellar price after rebounding off a crucial level. Martinez noted that the altcoin could be on its way to a new local high over the coming weeks. This bullish projection is based on the formation of a descending channel pattern on the XLM daily chart. For context, a descending channel is a common pattern in technical analysis characterized by two major (downward-sloping) trendlines. The upper boundary line connects a series of lower highs and the lower channel line connects the lower lows. The assets price typically persists within the channel; with the upper boundary line acting as resistance and the lower channel line considered a support floor. The descending channel formation is usually a bearish pattern, indicating the persistence of a downward trend. When the price breaks down the lower channel line, it signals the continuation of the downtrend. Conversely, a break out of the descending channel can be used to identify trend reversal points usually from a bearish trend to an upward trend. XLM’s price has been in this descending channel since November 2024, recently bouncing back from the lower boundary line. As observed in the chart above, the altcoin fell to support around the $0.23 level in early March, but it has since turned around toward the channels midline. According to Martinez, the next price target for XLM is $0.30 at the channels midline. However, the analyst believes Stellar could make a play for as high as $0.38 at the upper boundary line i.e. representing a potential 40% surge from the current market price. The last time the Stellar traded around the $0.38 region was in early February and has since plummeted as low as $0.23 since then. Stellar Price Overview As of this writing, the XLM token is valued at around $0.27, reflecting a 0.83% gain in the past 24 hours. According to data from CoinMarketCap, the Stellar price is down by 0.76% in the last seven days despite the woeful start to the week. Meanwhile, the altcoins value has declined by 17.25% in the past month. Related Reading: XRP Price To $110? Bollinger Bands Creator Reveals Why It Will Become A Market Leader Featured image from Medium, chart from Tradingview
The Stellar price prediction shows that XLM is attempting to cross above the upper boundary of the channel. Stellar Prediction Statistics Data: Stellar price now [...]
The comeback of the Stellar Lumens (XLM) price keeps going on. In the last 24 hours, XLM has risen by another 15%, bringing the Ripple competitor’s price in line with XRP. Indeed, both tokens have risen by close to 65% (at this stage) since the summary judgment in Ripple’s legal battle with the U.S. Securities and Exchange Commission (SEC). Remarkably, the relationship between Stellar Lumens (XLM) and Ripple’s XRP has been an intriguing tale of correlation and decoupling. As the market reacted to the recent developments in the Ripple-SEC battle, XLM followed suit, experiencing a remarkable price surge. However, as the broader market conditions cast their shadows, the question arises: Can Stellar Lumens maintain its newfound independence and continue its upward trajectory? The Correlation Between XLM and XRP It is no secret that Stellar Lumens and Ripple’s XRP share many similarities in their blockchain technologies and use cases. Moreover, the founder’s Jed McCaleb’s connection to Ripple adds another layer of intrigue, as investors hope that XLM will not be deemed a security by regulators. Related Reading: Stellar (XLM) Surges Over 43% In One Week, What’s Pushing It? This connection has often resulted in XLM mirroring the price movements of XRP. The market’s anticipation of developments for Ripple being equally impactful for Stellar has often led to such correlated movements, just like last week after the Ripple ruling. However, in recent days, Stellar Lumens has managed to stand on its own feet, showcasing its ability to decouple from the fortunes of XRP. One factor for this may have been its partnership with MoneyGram, which yielded the innovative B2B service called MoneyGram Access. This service enables the conversion of the stablecoin USDC into cash worldwide through MoneyGram’s branch network, tapping into Stellar’s ledger for seamless execution. This strategic collaboration has not only bolstered Stellar’s use case but also may catalyzed its recent surge in price. Related Reading: Stellar Makes Surprise 70% Rally – Start Of Something Big For XLM? With the integration of Access into various applications and fiat ramps, XLM’s demand and utility is substantially boosted. For instance, the HoneyCoin app’s integration of Access for straightforward cash out in multiple African countries and the United Kingdom might have contributed to Stellar’s outperformance relative to XRP in recent days. We’re excited to share @honeycoinapp users can now cash out of their USDC balance at supported @MoneyGram locations in Kenya, Uganda, Tanzania, Nigeria, Ghana, and the UK ??? Another real-world use case for @Circle’s USDC on Stellar.https://t.co/0JKNhdJMx3 — Stellar (@StellarOrg) July 17, 2023 A second factor for XLM’s recently strong performance could be the extremely high interest on the futures market. The open interest for Stellar Lumens has skyrocketed to over $120 million yesterday, a level not seen since the peak of the bull market in November 2021. Notably, this phenomenon is similar to XRP which has also seen open interest soar to prior record levels. Stellar Lumens Price Outlook Despite experiencing a sharp rally, Stellar Lumens still remains in rather bearish territory when looking at the 1-week chart. For this week, it’s crucial that the XLM price regains the 23.6% Fibonacci retracement level at $0,1583 as well as the 200-week EMA at $0,1597 (blue line). With the weekly RSI at 73, another leg up could be possible. On the 1-day time frame, XLM remains above all moving averages (EMAs). For a further bullish trajectory, it’s important that Stellar hold above the support at $0.1250. Should this happen, XLM could experience a further 35% rally towards the 38.2% Fibonacci retracement level. However, a drop below the support level at $0.1250 would challenge the bullish view. Featured image from oranfireblade / Pixabay,, chart from TradingView.com
The Stellar price prediction shows that XLM couldn’t break above the channel after touching the daily high at $0.082. Stellar Prediction Statistics Data: Stellar price [...]
The use of the Stellar blockchain will make it easier for the UNHCR to send USDC to Ukrainians in need. Who said crypto was a useless invention?
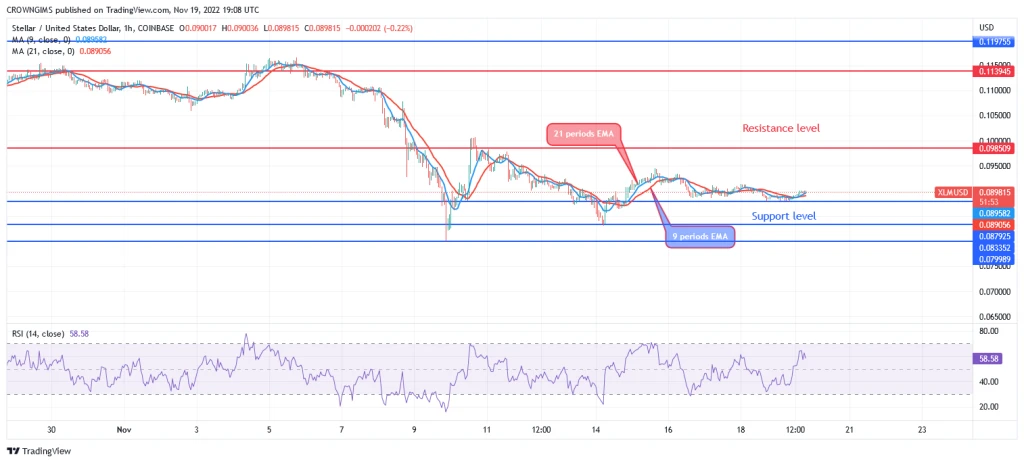
Buyers are quitting Stellar market. STELLAR Price Analysis – 19 November In case bears increase their momentum price may retest the previous low at $0.083 [...]
The Stellar (XLM) price prediction escalates, but a break above $115 is expected to push the coin above the moving averages. Stellar Prediction Statistics Data: [...]
The Stellar price prediction shows that XLM is attempting to cross above the upper boundary of the channel. Stellar Prediction Statistics Data: Stellar price now [...]
XLM price shows could be ready for a major boost as the price remains bullish with good volume and strength. XLM trades above support as the price aims to continue its trend movement as the price keeps holding above 8 and 20-day EMA. The price of XLM eyes a rally to $0.14 as the price breaks out of an ascending triangle with more buy orders. The price of Stellar (XLM) has continued to show its strength as price trends with a key breakout from a range-bound movement against tether (USDT). With the crypto market cap bouncing from its weekly low as the market continued to look promising, the price of Stellar (XLM) was not left out as the price broke out of its long-range, with price trending to a higher height with eyes set for a possible $0.14 target. (Data from Binance) Related Reading: This Data Shows Ethereum Whales Are Manipulating ETH Prices, Is That True? Stellar (XLM) Price Analysis On The Weekly Chart The crypto market received the relief, as most crypto altcoins expected. However, despite the recent price surge in most crypto assets, some altcoins have remained range-bound. One project that has shown great signs of a recovery bounce but keeps stalling in price is XLM as the price continues to range as it aims a rally to a height of $0.14. The price of XLM saw its price rejected to a weekly low of $0.1, with XLM showing so much strength holding off price sell-off as the price bounced to a region of $0.13. Weekly resistance for the price of XLM – $0.14. Weekly support for the price of XLM – $0.1. Price Analysis Of XLM On The Daily (1D) Chart On the daily timeframe, the price of XLM continues to show strength as it pulls some gains despite the market appearing to have stalled in price movement; after hitting a daily low of $0.1, the price of XLM rallied to a high of $0.13 before being rejected into an ascending triangle as it struggled to break out with price breaking out and looking more bullish for a rally. The price of XLM breaking out signals more bullish trends to a high of $0.14 and a possible rally to $0.16. The price of XLM holding 8 and 20-day Exponential Moving Average (EMA) is a good sign for price growth. The prices at $0.12 and $0.11 correspond to the 8 and 20-day EMA values. XLM’s price has a support level at 8, and 20 EMA, a break below this level would mean a retest of $1 or even lower. The Relative Strength Index (RSI) for XLM shows increasing buy orders as the value is above the 50 mark area daily. Daily resistance for the XLM price – $0.14. Daily support for the XLM price – $0.1. Related Reading: Shiba Inu: How This Newly Found Support Will Boost SHIB Price This Week Featured Image From Cryptoholics, Charts From Tradingview
The Stellar price prediction shows that XLM restarts the uptrend after crossing above the critical barrier of $0.115 to touch the daily high of $0.122. [...]
Stellar price has continued to travel south over the last 24 hours. On the last day, XLM lost more than 6% of its market value. Stellar has recorded positive price sentiment recently, owing to an update that spread optimism across the XLM community. In the latest update, Stellar users can now transfer USDC and Stellar Lumens via email. Despite the update, technical indicators have sided with the bears on the one-day chart. The buying power has fallen considerably, even though the number of buyers is greater compared to the number of sellers. In the last week, Stellar price went up close to 7%. However, at press time, the bulls look exhausted. The present support zone for XLM stands between $0.111 and $0.106, respectively. A fall from the $0.106 mark will lead the Stellar price to touch the $0.99 price mark. Broader market support will be necessary for most altcoins to recover. If buyers don’t pick up momentum and XLM doesn’t topple above the 20-SMA, then the altcoin is in for a further drop in price. Stellar Price Analysis: One Day Chart XLM was trading at $0.112 at the time of writing. The coin could not hold onto its weekly gains and fell on its chart as a result of declining buying strength. It is important for the bulls to defend Stellar at the $0.111 level, else Stellar price could drop down to $0.106. Once the coin touches the $0.106 mark, it could also fall near the $0.99 level. Overhead resistance for the coin stood at $ 0.116. A move above that level could push the coin to $0.119. The amount of Stellar traded in the past trading session declined, indicating a fall in buying strength. Technical Analysis XLM was still not in the excess selling territory, but if buyers continue to decline, sellers will soon take over. Stellar has had a good past week, but the bulls failed to move past the $0.116 resistance mark, causing the coin to depreciate in price. The Relative Strength Index was right on the half-line, and that is an indication of an even number of buyers and sellers. A fall in demand will immediately push the price of Stellar below the 20-SMA line. This would mean that the sellers were driving the price momentum in the market. Related Reading: TA: Ethereum Price Needs To Clear $1,400 For Hopes of a Fresh Rally There could be a chance for Stellar to redeem its price given that XLM continued to display a buy signal on the one-day chart. The Moving Average Convergence Divergence measures the price momentum and the overall price direction of the altcoin. The MACD continued to form green signal bars that correlate with the buy signal for the coin. Although the green histograms were declining on the chart as a sign of increased selling strength, sellers had not taken over yet. The Parabolic SAR displays the price action of the altcoin. The dotted lines below the price candlestick mean that XLM could rise on its chart again with sustained demand. Related Reading: Cardano Price Surges, Will The Bulls Hold The Recovery? Featured image from Personal Financial, Chart: TradingView.com
The Stellar (XLM) price prediction could set a bullish run if the market can keep the coin above the resistance level of $0.130 Stellar (XLM) [...]
Buyers are quitting Stellar market STELLAR Price Analysis – September 13 The price may retest the previous low at $0.075 and $0.057 provided the bears [...]
The Stellar price prediction shows XLM breaking above the $0.10 resistance level as the coin crosses above the moving averages. Stellar Prediction Statistics Data: Stellar [...]
World Crypto Global opens the door to digital freedom for everyone.
Manage your free WCG Coins securely—where simplicity meets global accessibility.
FREE CRYPTO COINS
AVAILABLE FOR RESERVATION
ALREADY ALLOCATED

No fees. No catch. Your crypto journey starts here.