W o r l d . C r y p t o . G l o b a l

Loading

Welcome at World Crypto Global. This portal is packed with useful content and resources to built out your own crypto skills. WorldCrypto is a site member of Gabriel Vega Network.

Contact Info

CATEGORY: solana rally


Jun 29, 2024 12:05

Solana (SOL) Surges 18%, But Watch Out For Crowd FOMO

Solana has been showing a breakout over the last few days, but data shows crowd FOMO is rising, which could be a bad sign for the rally. Solana Social Volume Has Shot Up Alongside The Rally According to data from the on-chain analytics firm Santiment, the SOL social volume has observed a sharp increase following the recent recovery of cryptocurrency. The “Social Volume” here refers to an indicator that keeps track of the degree of discussion that any given asset receives on the major social media platforms. Related Reading: Retail Losing Interest In Bitcoin? Volume Plunges 30% This metric makes this measurement by counting up the unique number of posts/threads/messages, making at least one mention of the cryptocurrency. The indicator doesn’t simply count up the mentions themselves because sometimes a large number of mentions can crop up within a couple of posts, while at the same time, the discussion could be more or less dead on the rest of social media. The high mentions would suggest a lot of discussion in this case, but in reality, the talk is all contained within niche circles. By measuring the number of posts, the Social Volume can tell us about the trend across social media. Now, here is a chart that shows the trend in the Solana Social Volume over the past week or so: As is visible in the above graph, the Solana Social Volume has registered some rapid growth recently. This would imply that the intensity of discussions related to the asset has suddenly spiked. The driver behind this increase in the indicator is likely to be the rally that the coin’s price has enjoyed recently. In this new surge, SOL has recovered from a low of around $124 to the current $146 mark, meaning it has seen returns of almost 18% in just a few days. The Social Volume spiking alongside a rally isn’t unusual, as social media users find sharp price action exciting, so they participate in more discussions than normal. However, the scale of the spike that the metric has seen this time may be worth noting. Historically, the asset’s price has tended to move against the majority’s expectations, so too much excitement too suddenly can be a bearish sign for the cryptocurrency. In the same chart, Santiment has attached the Social Volume for Avalanche (AVAX) data, which has also witnessed a recovery run. It would appear that, unlike the Solana surge, few are paying attention to Avalanche’s rally, as the indicator’s value has remained relatively low. Related Reading: Bitcoin Near Euphoria Boundary: What Happens After A Breach? Therefore, AVAX’s rally could be more likely to be sustainable than SOL’s, as it has been seeing much less FOMO, at least according to the Social Volume. SOL Price Solana had broken past the $151 level yesterday, but the asset has since seen a minor pullback to $146. It’s currently unclear if this means that the negative effect of FOMO is already kicking in for SOL. Featured image from Shutterstock.com, Santiment.net, chart from TradingView.com

Solana Rallies Into Pivotal Zone  $180 Level Could Define Next Move

Author: Sebastian Villafuerte
United Kingdom
May 12, 2025 12:05

Solana Rallies Into Pivotal Zone $180 Level Could Define Next Move

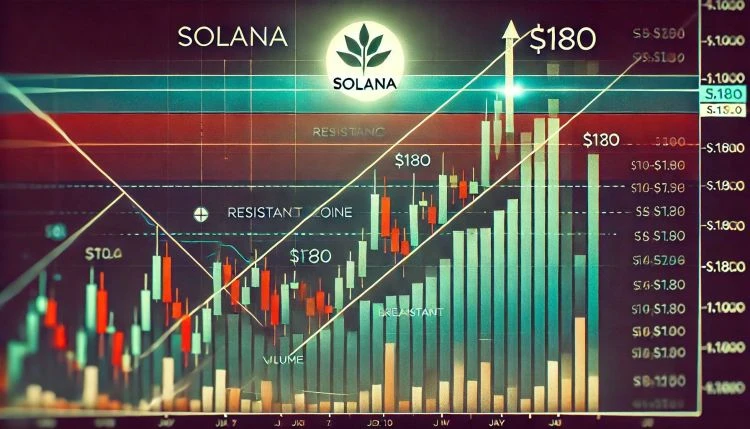
Solana is gaining momentum once again, with price action pushing above the $175 level for the first time in weeks. The move comes as crypto markets roar back to life, fueled by Bitcoins push above $100K and Ethereums explosive rally past $2,500. Solana has surged more than 20% in the past week alone, signaling strong demand and a renewed bullish outlook from traders and investors alike. Related Reading: XRP Whales Are Back 880 Million Tokens Accumulated This Month Top analyst Big Cheds shared a technical analysis revealing that Solana is now making a strong advance into a key spotthe underside of the daily 200 moving average (DMA). The asset is also approaching a lower high around the $180 mark, which previously acted as resistance during the last failed breakout attempt. Cheds notes that reclaiming this zone would be a significant win for bulls, potentially triggering a sharp continuation toward new highs. Market sentiment is turning optimistic across the board, and Solanas technical setup reflects that shift. As price approaches the 200DMA, all eyes are on whether SOL can hold this momentum and break through key levels to join the broader market rally. The coming days will be crucial for confirming a full trend reversal. Solana Approaches Pivotal Level As Bulls Eye Breakout Solana is showing renewed strength after a clean breakout above the $160 resistance zone, a level that had capped price action for several weeks. The surge has brought SOL into a critical region that could act as a pivot pointeither igniting a fresh bullish rally or marking a temporary top before a retrace. As global tensions between the US and China and broader macroeconomic uncertainties linger, the crypto market remains exposed to sudden sentiment shifts. However, recent price action in Solana, along with Bitcoin and Ethereum, suggests that investors are increasingly optimistic about a continued market recovery. Solanas current structure reflects that optimism. The asset is now testing the underside of its daily 200 moving average, a level often viewed by traders as a trend-defining indicator. A successful push above this moving average would add further confidence to the bullish thesis. At the same time, Solana is approaching a lower high near the $180 zone, where the price was previously rejected in March. Cheds points to this convergence as a crucial area: a breakout here could mark the beginning of a larger reversal pattern. Still, risks remain. A rejection at the $180 level could reinforce resistance and trigger a pullback toward the $160 support, especially if macro conditions worsen or profit-taking sets in. For now, however, bulls appear to be in control, and the technical landscape supports a potential continuationif momentum holds. Related Reading: Bitcoin 4H Chart Shows Bullish Consolidation Classic Continuation? Technical Levels: Price Action Shows Strength Solana (SOL) is exhibiting strong momentum as it trades at $176.41, advancing toward a crucial resistance area around the $180 level. The daily chart shows that SOL has surged rapidly from April lows, breaking above both the 200-day EMA ($161.67) and approaching the 200-day SMA ($181.10), a key area that could determine the next major trend. This zone acted as support and resistance multiple times in the past, particularly during Q4 2024 and early 2025. Now, as price returns to this range, it becomes a potential pivot point. If bulls can sustain pressure and close above $181.10 with volume confirmation, it may trigger a continuation toward $200 and possibly retest February highs above $260. However, failure to break above this range could prompt a rejection and consolidation below the 200 SMA. Related Reading: Bitcoin Whale Entry Prices Diverge Sharply Confidence Builds At Higher Levels Volume has picked up significantly over the last few days, indicating rising interest and participation from traders. This is a constructive sign as Solana attempts to reclaim higher ground. For now, the trend remains bullish, but eyes are on the $180$185 resistance zone to confirm whether SOL has the strength to continue its breakout or faces a short-term pullback. Featured image from Dall-E, chart from TradingView

Solana Breaks Above Key Resistance At $225  ATH Next?

Author: Sebastian Villafuerte
United Kingdom
Nov 18, 2024 12:05

Solana Breaks Above Key Resistance At $225 ATH Next?

Solana (SOL) has captured the markets attention after a series of volatile days, finally breaking above the $225 mark to reach new yearly highs. Currently trading at $235, Solana sits just 10% below its all-time high, sparking excitement among investors and analysts alike.  Related Reading: Last Chance To Buy Ethereum? Analyst Expects $6,000 Once It Breaks 8-Month Accumulation Top analyst Ali Martinez recently shared a chart highlighting Solanas potential for further upside. According to Martinez, the price is targeting the $250 level, which represents a critical supply zone. A successful breakout above this level could pave the way for Solana to challenge its all-time high, igniting a wave of bullish sentiment across the market. The next few days are shaping up to be crucial for Solana as it tests the resilience of its upward trajectory. Bitcoins bullish performance is also fueling optimism across the market, further supporting Solanas price action. The recent breakout signals growing bullish momentum as Solana continues to outperform many other altcoins in the crypto market. Solana About To Enter Price Discovery Solana is on the verge of entering price discovery after successfully confirming a breakout above the critical $225 resistance. This pivotal move has reinforced bullish sentiment, with many analysts predicting an imminent surge to new all-time highs. As Solana breaks through key supply levels, its strong price action has positioned it as one of the most promising assets in the current market cycle. Martinez shared his technical analysis on X, emphasizing the significance of this breakout. According to Martinez, Solana appears to be entering a bullish phase, and this recent surge is just the beginning of a much larger upward trend.  He identified $250 as the next target for Solana, which lies just below the all-time high of $259 set in November 2021. Martinez suggests that reaching these levels could ignite a sustained rally, pushing Solana into price discovery territory. Related Reading: XRP Breaks Above Multi-Year Resistance Top Analyst Shares Price Target The confirmation of the $225 breakout signals growing demand, driven by both institutional interest and broader market optimism. If Solana successfully tests and holds above the $250 mark in the coming days, it could trigger a domino effect, paving the way for further bullish momentum. Entering price discovery would likely attract significant buying pressure, driving Solana to uncharted territory and establishing new highs. Bullish Price Action: SOL Levels To Watch  Solana is trading at $236, clearing yearly highs and setting a new local high just 10% below its all-time high (ATH). The price surged 9% today, signaling strong bullish momentum and renewed investor confidence in Solanas upward trajectory. Bulls appear to be in full control of the price action, with demand driving significant upward pressure. To sustain this breakout and maintain its bullish momentum, SOL must hold above the $225 mark in the coming days. This level is now a crucial support zone that validates the recent breakout and sets the stage for Solana to challenge its ATH. A successful retest and hold above $225 would likely pave the way for SOL to continue its climb toward new record highs. Related Reading: Bitcoin Spot Is King STH Selling Pressure Expected To Be Absorbed By ETFs However, if SOL fails to maintain this critical level, a period of sideways consolidation could ensue. Such a consolidation phase would not necessarily indicate weakness but rather a healthy pause, allowing the market to absorb recent gains before resuming its upward trend. In this scenario, bulls would still have the opportunity to reclaim control and propel SOL to new highs after establishing a stronger foundation. For now, all eyes are on Solana as it inches closer to price discovery and potential new ATHs. Featured image from Dall-E, chart from TradingView

Oct 15, 2024 12:05

Solana Extends Rally By 4%, But This Factor Could Lead To A Top

Solana (SOL) has continued its recent bullish wave during the last 24 hours with a surge of 4%, but the trend in this social media-related metric could be to watch out for. Traders May Have Become Too Hyped Around Solana On Social Media Recently According to data from the analytics firm Santiment, the positive sentiment around SOL on social media has shot up to a nine-month high following the latest bullish momentum that the coin has seen. Related Reading: Bitcoin Whales Are Going Through A Generational Shift, CryptoQuant CEO Reveals The indicator of relevance here is the “Positive Vs. Negative Sentiment,” which, as its name suggests, keeps track of the ratio between the amount of positive and negative comments related to Solana that are appearing on social media. This metric works by analyzing the posts/threads/messages on various social media platforms (X, Reddit, Telegram, 4Chan, and BitcoinTalk) and running them through a machine-learning model to determine which ones relate to positive sentiment and which ones relate to negative sentiment. When the indicator has a value greater than 1, it means the number of positive posts are outweighing the negative ones right now. On the other hand, it being under the mark implies the dominance of bearish comments. Now, here is a chart that shows the trend in the Positive Vs. Negative Sentiment for Solana over the last few months: As displayed in the above graph, the Solana Positive Vs. Negative Sentiment has registered a large spike as the latest recovery in the asset’s price has taken place. With this spike, the indicator has reached a value of more than 5.6, which means social media users are making over 5.6 times as many bullish posts as bearish ones. This is the highest that the metric has been in around nine months, so the traders are clearly quite optimistic about the current SOL rally. While some bullish moods can be conducive to rallies, an excess of them can actually prove to be an obstacle. Historically, cryptocurrencies like Solana have tended to show moves that are opposite to what the crowd is expecting. The probability of a contrary move rises the more sure the traders become of a direction, so a highly bullish market can lead to tops in the price. Related Reading: Spot Bitcoin ETFs Back To Positive Returns With $308 Million Inflows Details This effect is also visible in the chart, as some past spikes in the Positive Vs. Negative Sentiment had occurred around local tops in Solana’s value. So far, SOL has only continued to rally further despite the investor FOMO, but considering the historical pattern, it’s possible a top may be hit before long, should hype on social media maintain at high levels. SOL Price Solana has continued its latest run with a 4% surge over the past day, which has taken its price above the $153 level. Featured image from Shutterstock.com, Santiment.net, chart from TradingView.com
Solana Prepares For A 20% Rally  Can SOL Reclaim $176?

Author: Sebastian Villafuerte
United Kingdom
Oct 13, 2024 12:05

Solana Prepares For A 20% Rally Can SOL Reclaim $176?

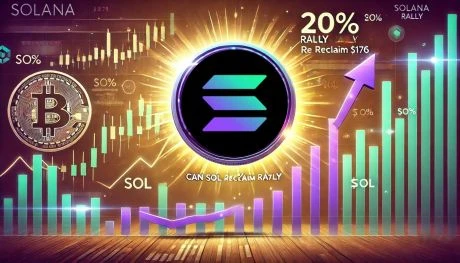
Solana is currently trading above the $140 mark, showing signs of strength as it prepares for a potential move to higher levels. After a modest 5% pump on Friday, investors and analysts are increasingly optimistic about the direction Solana could take in the coming months.  One prominent analyst, Carl Runefelt, has shared a technical analysis predicting a 20% surge for SOL in the next few weeks, citing bullish patterns and favorable market conditions. His analysis suggests that Solana could reach $176 by the end of the year if current momentum holds. Related Reading: Dogecoin Targets $0.11 As Short-Term Traders Fuel DOGE Price Details However, Solana still faces key resistance levels that could challenge its upward trajectory. Despite the recent surge, some market participants are cautious, given the overall volatility in the crypto space. If Solana manages to maintain its current support and break through resistance, the next few months could be pivotal for the assets long-term price action. Can SOL capitalize on its recent gains and reach new highs, or will it struggle to maintain momentum in the face of market headwinds? Investors are eager to see how this plays out as we approach the end of the year. Solana Testing Supply Levels Solana has been trading within a range of $210 to $110 since mid-March, leading to mixed opinions among investors. While some see this price action as a consolidation phase, others believe it could signal an upcoming breakout. Notably, top analyst and entrepreneur Carl Runefelt recently shared a technical analysis on X, revealing a bullish triangle pattern forming for SOL. According to Runefelt’s analysis, if Solana breaks out of this triangle pattern, it could experience a sharp upward movement, potentially reaching $176 in the coming weeks. This would represent a significant surge from its current trading levels and a key milestone for SOL. The price has struggled to break through the $160 resistance level since early August, but Runefelt suggests that a breakout from the triangle could push the price well beyond this resistance. Related Reading: Cardano (ADA) Testing $0.34 Support On-Chain Data Suggests Price Consolidation A successful break above these critical levels would mean a 20% surge for Solana, with bullish momentum potentially driving it even higher. Investors are closely watching these movements, as a breakout could signal the end of Solana’s extended sideways trading and mark the start of a new upward trend. If SOL can maintain support and continue this rally, it may soon test new highs and solidify its position as one of the top-performing altcoins. SOL Technical Analysis: Zones To Watch Solana (SOL) is currently trading at $145, following a 7% surge from local lows at $135. The price has managed to rise above the daily 200 exponential moving average (EMA) at $140, a key indicator of short-term trend strength. However, SOL is still 4% away from the crucial 200 moving average (MA) at $152, which represents a stronger, longer-term trend signal. A breakout above both the EMA and MA levels is essential for bulls to fully regain control and reclaim the trend. Surpassing these indicators could pave the way for a move to the $160 supply zone, where sellers are expected to be more active. This would signal a continuation of bullish momentum, with potential for further gains. Related Reading: XRP Will Jump 75% If It Holds Current Demand Level Details On the other hand, if the price fails to hold above the $140 mark, this recent surge could be short-lived, and a deeper correction might follow. A break below this level could drive SOL down to $110, which is a significant demand zone that buyers may defend. Traders are keeping a close eye on these levels as the next few days will determine SOL’s s`hort-term direction. Featured image from Dall-E, chart from TradingView

Solana Bullish Pattern Signals Massive Gains Ahead  2021 Rally Could Repeat

Author: Sebastian Villafuerte
United Kingdom
Oct 11, 2024 12:05

Solana Bullish Pattern Signals Massive Gains Ahead 2021 Rally Could Repeat

Solana (SOL) is currently trading at the lower end of a monthly range that began in March, positioning the asset at a pivotal level that will dictate its price action in the coming months. As the broader crypto market faces uncertainty, analysts and investors closely monitor whether this range represents an accumulation phase that could precede a significant rally. Related Reading: XRP Will Jump 75% If It Holds Current Demand Level Details Top analyst and investor Mister Crypto recently shared a technical analysis comparing Solanas current price structure to its 2021 performance, highlighting similarities that suggest a potential bullish breakout. His analysis reflects optimism amid market anxiety, with many believing Solana may be on the verge of another strong upward movement. While caution remains, investors await confirmation that Solanas recent range-bound trading is laying the foundation for a sustained rally. The outcome in the next few weeks could significantly impact Solanas trajectory for the rest of the year. Solana Price Action: Accumulation Or Bull Trap? Solana (SOL) has been trading within a range of $210 to $110 since mid-March, and while some investors are starting to believe this could be a bull trap rather than accumulation, others remain cautiously optimistic.  A growing sentiment suggests that Solana’s prolonged sideways movement may not lead to the much-anticipated breakout but could lead to further declines. Despite these concerns, prominent analyst Mister Crypto provides a more bullish perspective. In his latest analysis, Mister Crypto compares the current market sentiment around Solana to that of 2021, just before the asset soared to new all-time highs. He highlights the similarities in market fear and uncertainty that preceded Solanas previous explosive rally. According to him, such fear-driven consolidation is often a signal of bullish patterns taking shape, with the potential for substantial gains once the market recovers. Mister Crypto refrains from setting a specific price target but suggests that Solanas next major move could surpass its all-time high of $260. While the current mood remains cautious, his analysis provides hope that Solana may be preparing for another significant upward move, as historical patterns have shown similar price behavior before major surges. Related Reading: Cardano (ADA) Testing $0.34 Support On-Chain Data Suggests Price Consolidation The coming weeks will likely be decisive for Solana as traders and investors wait to see if it will break out of its range or continue to face downside pressure. SOL Key Levels To Watch Solana (SOL) is currently trading at $138, following a 9% retrace from its daily 200 moving average (MA) at $152. This drop marks a significant loss of momentum, as the price also fell below the daily 200 exponential moving average (EMA) at $140a crucial support level. Losing the 200 EMA raises concerns for further downside potential in the coming weeks. For bulls to regain control, the price must reclaim the 200 MA and EMA, and push above the critical resistance level at $160. A surge above this threshold would indicate renewed bullish momentum and the potential for Solana to rally higher. However, if SOL fails to recover these key indicators, it could signal a deeper correction. Related Reading: Dogecoin Analyst Expects A Multi-Year Bullish Breakout 200% Surge Potential If the price continues to decline, traders may see SOL head toward lower demand zones around $110, a level that has acted as strong support in previous months. Investors and analysts are watching closely to see if Solana can hold its current levels or face more downside pressure in the near future. The next few days will be pivotal for SOLs price action and overall market direction. Featured image from Dall-E, chart from TradingView

Solana poised for 2025 rally, Fetch.ai launches $10M fund: Finance Redefined

Author: Cointelegraph by Zoltan Vardai
United States
Jan 11, 2025 12:00

Solana poised for 2025 rally, Fetch.ai launches $10M fund: Finance Redefined

Solana is becoming the preferred cryptocurrency for retail investors, bolstering analyst expectations for another year of significant gains as the industry awaits the first US spot SOL ETF.

Solana (SOL) Tallies 10% Gains On Weekly Chart – Will It Cross $25?

Author: Olowoporoku Adeniyi
United Kingdom
Jul 09, 2023 04:45

Solana (SOL) Tallies 10% Gains On Weekly Chart – Will It Cross $25?

Solana (SOL) has witnessed a remarkable recovery in the past week, showcasing a string of steady gains. Presently, SOL has increased by 10% and is actively traded at $21.80, reflecting a slight uptick in the crypto’s price. While it’s important to note that SOL remains significantly distant from its all-time high of $260, the recent upward motion has lifted its value beyond the $20 mark, indicating promising signs of an extended bullish sentiment What’s Behind SOL Rise?  There are several factors right now that could have influenced the rise in SOL’s price. These include macroeconomic factors such as inflation and crypto regulation in different areas. In addition, Solana has experienced some success in adoption with some ecosystems adopting the token and launching cross-chain bridges.  Related Reading: XRP Next Step: Here’s Why An Upward Move Could Be Likely However, the most likely factor is the increase in DEX volume recorded this week. Blockchain analysis platform DefiLlama revealed in a report earlier in the week that Solana had experienced a spike in DEX volume. According to the report, SOL’s DEX volume surged by over 80% and is ranked fifth within the crypto market. This development is likely to have boosted its price action in the past week.  Nonetheless, the Total Value Locked (TVL) has not reacted to this uptrend and has been stagnant since its decline last November following the FTX collapse. Currently, the TVL sits at around $275 million with no noticeable increase in value despite the gains of SOL in recent days.  Solana (SOL) Price Outlook And Prediction  SOL is currently trending upward and has continued its positive price action towards the weekend. However, the intermittent red candles on its weekly chart show that the bears are active this week.  Looking at the technical indicators, its relative strength index is at 50 in the neutral zone between the oversold region of 35 and the overbought region of 75. The Moving Average Convergence/Divergence (MACD) is currently in the buy zone which is a bullish signal. In addition, the histogram bars are green and signal that a bullish trend is ahead and if the bulls persist, SOL is likely to have a sustained uptrend in the coming days.  SOL is trading at $21.83 after it found critical support at the $15.43 price level weeks ago. This puts the altcoin close to the $22.50 resistance level. Related Reading: PEPE Bulls Losing Steam? Fatigue Appears To Undermine Price Rally A break above the $22.50 resistance level will help to boost its price to reclaim the $25 psychological resistance level. If this happens, SOL will likely rally to the $23.00 resistance level after breaking above $22. However, a price decline below $20 in the short term remains possible due to external market conditions that are bearish.  (This site’s content should not be construed as investment advice. Investing involves risk. When you invest, your capital is subject to risk). Featured Image from iStock, chart from TradingView

Jul 06, 2023 04:45

Solana Registers 20% Rise In Past Week, But Can SOL Keep This Up?

Solana has observed an increase of more than 20% in the past week. Here’s what on-chain data says regarding whether this is sustainable or not. Solana Trading Volume Has Remained Low Despite Price Rise In its latest insight post, the on-chain analytics firm Santiment has looked at the underlying metrics of Solana to see what has been driving the latest increase in the price. The firm has looked at the “social volume” of the cryptocurrency for various social media platforms and has found that the asset has seen elevated interest on Reddit recently. Here, the social volume refers to a metric that measures the total number of unique posts or threads on a given social media platform that is making at least one mention of SOL. This metric can tell us about the degree of discussion that the coin is currently receiving on the website in question. Now, below is a chart that shows the trend in the Solana social volume on four major social media platforms: Telegram, Reddit, Twitter, and 4chan. Looks like the value of the metric has been relatively low for most of these platforms | Source: Santiment As displayed in the above graph, the Solana social volume on Reddit has seen some spikes as the cryptocurrency has risen during the past week or so. The other platforms, however, haven’t observed that much discussion related to the asset. Related Reading: Blame The “Supermoon” If Bitcoin Crashes Or Rallies Towards $35,000 In July A notable spike in the social volume on Reddit also occurred before the coin’s 5% surge during the past 24 hours. This may imply that interest from users on the platform could partly be helping fuel the rise. In terms of the actual trading volume, though, SOL has continued to observe muted activity, despite the growth. Here is a chart that displays the trend in this indicator: The value of the metric hasn't been too high recently | Source: Santiment Interestingly, the initial, strong rise that Solana enjoyed was accompanied by elevated volumes, but at the start of this month, the indicator’s value noted some decline. Since this drop in volume, SOL has mostly moved sideways. Generally, for any price rise to be sustainable, high trading volumes are required. This is due to the fact that participation from a large number of traders is needed to provide enough fuel for any such price move to go on. Related Reading: Bitcoin Cash (BCH) Registers 28% Gain – How Long Will It Last? Despite the sharp growth that Solana has observed today, the trading volume remaining at low values would suggest that the wider market isn’t finding the rally interesting enough to make moves on the network. Naturally, if the rally has to go on for an extended period, volumes may have to return to the market. There is also the fact that the SOL funding rates (a measure of the periodic fee that futures traders are exchanging between each other) on Binance and DyDx have become quite positive recently. Longs are dominating the market | Source: Santiment From the graph, it’s visible that the earlier increase in the asset’s price may have been helped by shorts being liquidated in the market – as the funding rates had been highly negative then. As long contract holders are the majority force in the futures market now, the chances of a long squeeze taking place are higher now. In this case, if one does take place, the price would feel a bearish effect. SOL Price At the time of writing, Solana is trading around $20, up 20% in the last week. SOL has shot up in the past day | Source: SOLUSD on TradingView Featured image from GuerrillaBuzz on Unsplash.com, charts from TradingView.com, Santiment.net

Your Crypto Gateway

Claim 1,000
Free WCG Coins

World Crypto Global opens the door to digital freedom for everyone.
Manage your free WCG Coins securely—where simplicity meets global accessibility.

11 bn

FREE CRYPTO COINS

8.9 bn

AVAILABLE FOR RESERVATION

2.1 bn+

ALREADY ALLOCATED

× WCG Coin

🎉 Get 1,000 WCG Coins

No fees. No catch. Your crypto journey starts here.