W o r l d . C r y p t o . G l o b a l

Loading

Welcome at World Crypto Global. This portal is packed with useful content and resources to built out your own crypto skills. WorldCrypto is a site member of Gabriel Vega Network.

Contact Info

CATEGORY: reversal


Aug 24, 2024 12:05

Bitcoin Investors Are Still Fearful: What Needs To Happen For A Turnaround?

Data shows that Bitcoin investors still hold a sentiment of fear as the cryptocurrency’s price continues to consolidate. Bitcoin Fear & Greed Index Is Currently Pointing At ‘Fear’ The “Fear & Greed Index” is an indicator created by Alternative that, in short, tells us about the general sentiment present among the traders in the Bitcoin and wider cryptocurrency markets. Related Reading: Aave Forms Sell Signal That Led To 27% Average Correction Last 4 Times To determine this sentiment, the index uses the data related to the following five factors: volatility, trading volume, social media sentiment, market cap dominance, and Google Trends. The indicator represents this mentality as a score between zero and hundred. Investors share a sentiment of greed when the metric has a value greater than 53. On the other hand, being under 47 implies dominance of fear in the market. The region between these two thresholds naturally corresponds to the neutral sentiment. Now, here is what the current value of the Fear & Greed Index looks like: As is visible above, the Bitcoin Fear & Greed Index is 34 at the moment, suggesting that the investors are feeling fear. The current fearful mentality isn’t too strong, given the distance to the neutral territory. Earlier in the month, the indicator had shown particularly low values, as the chart below displays. On August 6th, the Fear & Greed Index had hit a low of 17, the lowest that it had gone in more than two years. When the indicator achieves such low values, it no longer reflects just fear but rather a special sentiment called extreme fear. Extremity fear is defined as the zone that occurs at 25 and under. There is also a similar region for the greed side, called extreme greed, occurring over 75. Interestingly, the extreme fear low coincided with Bitcoin’s bottom under the $50,000 level. This is similar to what has been observed throughout the asset’s history. Related Reading: These Are The Biggest Bitcoin Support & Resistance Zones, Analyst Reveals BTC has tended to move opposite to the expectations of the majority, and the extreme sentiment zones are evidently where this expectation is the strongest, so it makes sense that reversals in the price would also be the most likely to occur inside them. With the sentiment sitting in the normal fear territory and the Bitcoin price consolidating, another foray into the extreme fear may be needed if Bitcoin has to kickstart fresh bullish momentum. How the indicator develops in the coming days remains to be seen. BTC Price Bitcoin has been unable to find a solid break above the $61,000 level recently, and it appears that the latest attempt may have ended in a similar failure as BTC, which has retraced to $60,800. Featured image from Dall-E, Alternative.me, chart from TradingView.com

Aug 20, 2024 05:50

Bitcoin Holders Now Doing Loss-Taking: Sign That A Turnaround Is Near?

On-chain data shows that Bitcoin investors have ended their net profit-taking spree recently, a potential sign that a price reversal could occur soon. Bitcoin Daily Realized Profit Loss Ratio Has Dipped Below 1 Recently As explained by CryptoQuant author Axel Adler Jr in a new post on X, realized losses have started to exceed profits [...]

The post Bitcoin Holders Now Doing Loss-Taking: Sign That A Turnaround Is Near? appeared first on Crypto Breaking News.

Ethereum Breaks Massive Downtrend Price Structure  Momentum Shift?

Author: Sebastian Villafuerte
United Kingdom
May 06, 2025 12:05

Ethereum Breaks Massive Downtrend Price Structure Momentum Shift?

After enduring months of aggressive selling pressure, Ethereum is finally showing signs of life. As bullish momentum slowly builds, hopes for a recovery rally are beginning to resurface. While ETH continues to trade below the key $2,000 mark, bulls are actively defending critical demand zones in an effort to reclaim lost ground and reestablish a bullish structure. Related Reading: Cardano Consolidates In Symmetrical Triangle Analyst Sets Bull/Bear Price Targets The market has been under stress for much of 2025, with Ethereum suffering extended drawdowns and repeated rejections at resistance. However, sentiment is shifting. Top analyst Ted Pillows recently shared a technical analysis noting that Ethereum has officially broken out of its downtrend for the first time since December 2024an early sign that conditions could be improving. This breakout marks a key shift in structure and comes as trading volume starts to recover. Traders and investors are now watching closely to see if ETH can sustain its recent strength and push back above $2,000, which remains a major psychological and technical barrier. The next few days may prove critical, as Ethereum tests its newfound momentum in a still-uncertain macro environment. If bulls succeed, a broader altcoin rally could follow. Ethereum Consolidates As Bullish Momentum Begins to Build Ethereum is currently trading around the $1,800 level, consolidating in a narrow range after a prolonged period of downside pressure. While the broader market begins to heat up, ETH still lacks a clear directional move and remains over 55% below its December 2024 highs. Despite this, subtle shifts in structure suggest a potential trend change, especially in the lower time frames where early bullish patterns are beginning to emerge. The price action reflects a critical inflection point. Ethereum is hovering near major support zones, and bulls must now build enough momentum to break above key resistance levels if they want to regain control. So far, the consolidation has provided a base, but a definitive move has yet to materialize. The next legwhether up or downwill likely be decisive for ETHs near-term trend. Pillows recently shared a notable technical development: Ethereum has finally broken out of its downtrend for the first time since December 2024. Previous breakout attempts were rejected, but this time the breakout appears stronger and more sustained, supported by improving market sentiment and structure. Pillows believes its time for Ethereum to catch up to the broader market. While Bitcoin pushes toward new highs, ETH has lagged behind. If the current breakout holds, Ethereum could accelerate quickly and potentially retest key psychological levels above $2,000. The next few trading sessions will be critical for confirming this breakouts validity and determining whether Ethereum is ready to lead the next phase of the crypto bull cycle. For now, all eyes remain on whether bulls can maintain momentum and turn this early strength into a sustained rally. Related Reading: Ethereum Tests Critical Range: Breakout Or Breakdown? Technical View: Bulls Struggle To Reclaim $2,000 Level Ethereum (ETH) is currently trading at $1,807.99, consolidating in a tight range after a sharp recovery from its April lows. The 4-hour chart shows ETH holding above both the 200-period simple moving average (SMA) at $1,700.49 and the 200-period exponential moving average (EMA) at $1,783.99two key dynamic support levels that are now being retested as the asset tries to build bullish structure. While price action remains choppy, ETH appears to be forming a base above the $1,780 zone. The recent breakout above the downtrend line that defined price action since December 2024 is still intact, suggesting that Ethereum may be preparing for a larger move. Volume has decreased slightly during this consolidation phase, typical of a market waiting for a trigger. Related Reading: Cardano Whales Accumulated 410 Million ADA In April Breakout Coming? Ethereum continues to trade well below the psychological $2,000 resistance, but short-term momentum is slowly favoring the bulls. A break above the $1,860$1,880 range could clear the way for a push to retest $2,000. However, failure to hold the 200 EMA could send ETH back toward the $1,740$1,700 demand zone. Featured image from Dall-E, chart from TradingView

SEI Expected to Rise after it Completes an Inverse Head & Shoulders Pattern

Author: Paul Adedoyin
Estonia
May 20, 2025 02:30

SEI Expected to Rise after it Completes an Inverse Head & Shoulders Pattern

SEI has seen a bullish breakout occur for the first time since October and it remains above important support.

PEPE: There is a Sell Signal Present on the daily chart: Price Drop Soon?

Author: Paul Adedoyin
Estonia
May 16, 2025 02:30

PEPE: There is a Sell Signal Present on the daily chart: Price Drop Soon?

There could be a short-term decrease in PEPE's price because of the sell signal shown by the TD Sequential indicator.

May 13, 2025 02:30

Bittensor TAO Breaks Resistance, Bulls Target $540 With Momentum

Following weeks of sideways movement, Bittensor (TAO) has broken out of its long-standing downtrend firmly, crossing above important resistance levels and reigniting investor interest. Highlights a clear Break of Structure (BOS) above $270 as a confirmation of the reversal thesis quietly building up in the recent sessions. This structural break has more than a symbolic […]

Apr 24, 2025 02:30

Cardano (ADA) Price Prediction: Bullish Reversal Signals Breakout Toward $1.30

Cardano (ADA) is breaking out from its bearish pattern with fresh momentum. Positioning for potential upside as market sentiment shifts; bears are stepping back as bulls are in control. Key reversal pattern formed after recent rally. The $ADA price is currently sitting at a demand zone, with all confluence indicating a strong demand in the […]

Apr 23, 2025 02:30

BONK Price Prediction: Bullish Momentum Builds as Meme Coin Eyes Key Breakout

BONK (BONK) price is showing signs of a potential bullish reversal after enduring months of downward movement. Fueled by Bitcoins rally above $90,000 and a surge in market-wide optimism, BONK is gaining traction among traders and investors. On-chain data and technical indicators suggest that the meme coin could be on the verge of a breakout, […]

AI16Z Price Turns Bullish: MACD Crossover Signals Possible Upside Momentum

Author: Paul Adedoyin
Estonia
Apr 21, 2025 02:35

AI16Z Price Turns Bullish: MACD Crossover Signals Possible Upside Momentum

After AI16z remained flat for months, its chart is now showing a bullish MACD and rising RSI.

Apr 17, 2025 02:30

ATOM Bears Losing Steam; Bullish Reversal Pattern Points to the $9 Target

Cosmos (ATOM) is expressing a bearish trend with the overall market and showing signs of decline in its price due to BTCs recent price volatility. Its price over the last week is down by 13.38%, and over the last month it is down by 14.05%. At the time of writing, Cosmos is trading at $3.97 […]

3-Week Dips in Chainlink & Quant Signal Potential Rebound Ahead

Author: Paul Adedoyin
Estonia
Apr 17, 2025 02:30

3-Week Dips in Chainlink & Quant Signal Potential Rebound Ahead

Santiment says prices are dipping for Chainlink and Quant, and the FUD around both tokens is also rising. But a price rebound is likely.

Apr 17, 2024 12:05

Bitcoin Long-Term Holders Slow Down After 700,000 BTC Selloff, Reversal Sign?

On-chain data shows the Bitcoin long-term holder selling pressure has been running out recently after an extended selloff from the group. Bitcoin Long-Term Holders Have Sold Huge In Past 4 Months As analyst James Van Straten explained in a post on X, the long-term holders have massively reduced distribution during the last ten days. The “long-term holders” (LTHs) here refer to the Bitcoin investors carrying their coins since more than 155 days ago. The LTHs comprise one of the two main divisions of the BTC sector, with the other cohort known as the “short-term holders” (STHs). The STHs are naturally the investors who bought within the past 155 days. Related Reading: Bitcoin Has Next Major Demand Zone At $56,000: Brace For Impact? Statistically, the longer an investor holds onto their coins, the less likely they become to sell at any point. As such, the LTHs represent the more committed part of the BTC market. The STHs, on the other hand, are fickle-minded hands who may sell at the first sight of any FUD or profit-taking opportunity. As such, selling from the STHs is usually not that noteworthy. However, Selloffs from the LTHs can be something to watch for, as they rarely occur. One way to track the behavior of these Bitcoin cohorts is through the total amount of supply they carry in their respective combined wallets. The chart below shows the STH and LTH supply trend over the past year. How the supplies held by these two cohorts have changed during the past twelve months | Source: @jvs_btc on X As displayed in the above graph, the supply of Bitcoin LTHs increased through most of 2023. At the same time, the supply of STHs naturally decreased. Something to note here is that this increase in the LTH supply didn’t mean that these HODLers were buying then. Instead, some STHs bought 155 days ago and have finally held long enough to qualify for the cohort. Thus, there is a 155-day delay between accumulation and the increase registered in the LTH supply. When it comes to selling, though, no such time lag exists, as the LTHs who transfer coins on the blockchain immediately eject from the group and become part of the STHs. The chart shows that this trend of the supply of these diamond hands going up flipped this year, and the LTHs have been selling instead. In the past four months, these investors have distributed 700,000 BTC. Related Reading: Bitcoin Whales Showing Different Behavior From Past Cycles, But Why? This excludes the selloff from Grayscale Bitcoin Trust (GBTC), which has constantly been bleeding coins since the US SEC approved the spot exchange-traded funds (ETFs) in January. These coins had also matured enough to become part of the LTHs. Recently, as the price has gone through some bearish action, the LTH supply has flatlined, implying that the selling from these HODLers has finally stopped, at least for now. Given this new trend, it now remains to be seen how BTC’s value develops from here. BTC Price Following the latest drawdown in Bitcoin, its price has dropped towards the $63,200 level. Looks like the price of the asset has gone down recently | Source: BTCUSD on TradingView Featured image from Kanchanara on Unsplash.com, Glassnode.com, chart from TradingView.com
Mar 08, 2024 12:05

Crypto Analyst Optimistic About A Shiba Inu Short-Term Surge To $0.000066

Shiba Inu (SHIB) has displayed immense momentum lately standing out as one of the best-performing meme coins in light of the general optimism that took over the cryptocurrency market in the last week. Shiba Inu To $0.000066 Could Be Possible In A Short Time With the price of Shiba Inu rallying in the past few days, the crypto asset has garnered significant attention from investors as several experts predict a rise to new yearly highs. Related Reading: Shiba Inu Lead Dev Co-Signs Prediction That Would Send SHIB To $100 Billion In the same vein, cryptocurrency analyst and investor Rekt Capital has shared his optimistic prediction for Shiba Inu with the crypto community on the social media platform X (formerly Twitter), fueling hope of notable gains in the short term. Rekt Capital’s analysis underlines the digital asset’s potential to soar higher to a level not seen for more than 2 years. The crypto analyst pointed out that SHIB arrived at a resistance he dubbed “Black Resistance,” which it previously rejected. As a result, the meme coin must now “maintain the blue level” indicated in his chart as fresh support in order to create a “new Re-Accumulation Range at the highs possibly.” Due to this, the expert expects Shiba Inu to rise to the $0.000066 price level shortly. The post read: Shiba Inu Reached the black resistance which SHIB rejected from. Now SHIB needs to hold this blue level as new support to potentially develop a new Re-Accumulation Range at the highs. Rekt Capital also highlighted another of his earlier forecasts, in which he projected the coin to reach the aforementioned price mark. At first, Rekt Capital noted that the asset had reached the blue resistance point. Furthermore, he asserted that SHIB has increased by over 300%, since the initial post from November last year. In the post, the analyst claimed that SHIB regained the Orange area’s top as a support. Consequently, SHIB ought to be able to return to the pinnacle of its “black market structure over time.” However, he presently anticipates Shiba Inu to undergo a rally after it concludes its “Macro U-shaped reversal.”  SHIB Anticipated For A Potential Rebound Amid the recent bearish sentiment around the market, Santiment – a crypto analytics platform, has identified SHIB as one of the leading assets that is poised for a potential recovery. Related Reading: Shiba Inu Blasts Into Top 10 Crypto Following 175% Price Surge Data from Santiment shows that SHIB and dogwifhat (WIF) are the major coins expected by traders to undergo a rebound. This comes after the wild day that saw Bitcoin reach a new peak before markets went into a “reset mode.” Santiment has also underscored a “speculative bullishness” for Solana (SOL) lately. This is a result of the speculation surrounding Solana’s potential to reach the $1,000 threshold. SHIB at the time of writing was trading at $0.00003155, indicating a drop of 13% in the past day. Meanwhile, its market cap and trading volume are both down by 13% and 62% respectively. Featured image from Shutterstock, chart from Tradingview.com

Dogecoin Indicator Flashes A Buy Signal On The 4-Day Chart  Is DOGE Gearing Up For A Rebound?

Author: Sebastian Villafuerte
United Kingdom
Mar 07, 2025 12:05

Dogecoin Indicator Flashes A Buy Signal On The 4-Day Chart Is DOGE Gearing Up For A Rebound?

Dogecoin (DOGE) is currently trading below the $0.25 level after experiencing massive volatility and price swings in recent days. As the crypto market faces a broad correction, meme coins, including DOGE, have been some of the most affected assets, with bulls struggling to regain momentum. Related Reading: Whales Bought 420 Million Cardano After Trumps U.S. Strategic Crypto Reserve Announcement Insights Despite multiple attempts to push higher, DOGE has remained under pressure, failing to reclaim key resistance levels. Investors are closely watching whether bulls can regain control or if further downside is ahead. The uncertainty has left traders cautious, with many waiting for a strong signal of recovery before re-entering the market. Crypto analyst, Ali Martinez, shared insights on X, revealing that Dogecoin may be gearing up for a rebound. According to his analysis, the TD Sequential indicator has flashed a buy signal on a high time frame, suggesting that DOGE could be nearing a potential reversal. If bulls step in at current levels and capitalize on this setup, DOGE could see a strong recovery in the coming days. Is Dogecoin Preparing For A Recovery Rally? Dogecoin has been at its lowest since late 2024 as bullish sentiment fades, following a 60% decline from its multi-year high of $0.48. The correction has been brutal, with meme coins bleeding the most amid broader market weakness. DOGE now struggles to reclaim crucial liquidity levels, making it difficult to start a recovery rally. Market participants are closely watching for a decisive move, as analysts and investors remain on the sidelines, waiting for confirmation of either a break above crucial supply or a breakdown below current demand levels. Until a clear trend is established, uncertainty dominates DOGEs price action. Despite the bearish outlook, Martinez’s insights suggest Dogecoin may be gearing up for a rebound. According to his analysis, the TD Sequential indicator has flashed a buy signal on the 4-day chart, which could indicate that selling exhaustion is near. The TD Sequential is a well-regarded technical analysis tool that helps traders identify trend exhaustion and potential price reversals. On higher time frames, this indicator has historically been very effective, meaning this could present a major buying opportunity if DOGE follows its typical pattern. Related Reading: 2.23 Million Chainlink Moved To Exchanges In Two Weeks Selling Pressure Incoming? As market sentiment remains mixed, traders are keeping a close eye on DOGEs next major move. If buyers step in and confirm the TD Sequentials buy signal, Dogecoin could see a strong recovery in the coming days. However, failure to reclaim key levels may lead to further downside pressure, delaying any meaningful rebound. DOGE Holding Crucial Demand Dogecoin is currently trading at $0.209 after a period of volatile price swings, briefly dipping below $0.20 before recovering above $0.22. The market remains uncertain, with bulls attempting to regain control after weeks of selling pressure. For DOGE to confirm a strong recovery, bulls must reclaim the $0.25 level and establish it as a solid support zone. This would open the door for a push above the 200-day Moving Average (MA) and Exponential Moving Average (EMA), key resistance levels that could trigger a breakout to higher price targets. If DOGE successfully clears these technical barriers, momentum could shift in favor of buyers, leading to a more sustained uptrend. Related Reading: Ethereum Breaks Below Parallel Channel Is ETH Collapsing To $1,250? However, losing the $0.20 level again would be a bearish signal as it would indicate a lack of strong demand at current prices. If this scenario plays out, DOGE could drop further into lower demand levels around $0.14, a price zone that previously acted as a major accumulation area. Featured image from Dall-E, chart from TradingView

Mar 22, 2025 05:50

SECs XRP Reversal Signals Crypto Industry Win Before SOL Futures ETF Launch: Finance Redefined

The recent decision by the SEC to reverse its stance on XRP has been celebrated as a victory for the crypto industry. This reversal comes at a crucial time as the market continues to evolve and innovate. The announcement of the Sol Futures ETF has also brought about excitement in the finance world, showcasing the [...]

The post SEC’s XRP Reversal Signals Crypto Industry Win Before SOL Futures ETF Launch: Finance Redefined appeared first on Crypto Breaking News.

Mar 21, 2025 12:05

Ethereum CLS Shows Price Will Rebound Above $2,600, Heres Why

The Ethereum price is showing signs of a possible trend reversal as technical indicators like the Continuous Linked Settlement (CLS) suggest a breakout may be on the horizon. The crypto expert who shared this analysis has predicted that Ethereum is set to rebound to $2,600 in this bull cycle.  Ethereum CLS Sparks Potential Price Rally David Perk, a TradingView crypto analyst recently published a detailed technical analysis of the Ethereum price. The analyst forecasts that ETH could soon reach $2,600 and beyond in the coming months.  Related Reading: Crypto Pundit Says Ethereum Price Is Destined To Reach $10,000 This Cycle, Heres Why Perk based his predictions on Ethereums daily and monthly CLS. According to his analysis, if Ethereums price action can respect its daily CLS and liquidity zone, it could gradually move upward, targeting its monthly CLS of $2,055 before skyrocketing above $2,600.  His analysis report described in detail what CLS means and how it can affect a cryptocurrencys trajectory. Perk disclosed that CLS represents smart money across all markets. It is the global settlement system used by major financial institutions, including Foreign Exchange (FOREX) markets.  The crypto analyst suggested that CLS processes a massive volume of capital from large investment and central banks, boasting a daily volume of more than $6.5 trillion. In the case of Ethereum, since CLS follows a structured settlement process, traders who track these cycles can potentially anticipate significant price changes and liquidity shifts. Moreover, by knowing when large institutional money is entering or exiting the market, analysts can predict ideal entry and exit points for a cryptocurrency.  Perks Ethereum price chart shows an area marked in green, which represents the cryptocurrencys liquidity zone. Additionally, the daily and monthly CLS can be seen, with the former acting as a support area and the latter as a resistance or target for future price movements.  ETH Falling Wedge Breakout Targets $2,800 In other news, crypto analyst Marzell has shared a bullish prediction of the Ethereum price in an X (formerly Twitter) post. Marzell announced that Ethereum has successfully broken out of a Falling Wedge pattern.  Related Reading: Ethereum Price Recovery: Analyst Predicts Blow Off Top To $3,300 In One Week, Heres Why The Falling Wedge is known as a common bullish reversal pattern where a cryptocurrencys price moves within two converging trend lines, forming lower highs and lower lows. Notably, Ethereum has broken out of this wedge, signaling a potential rebound is imminent. The breakout occurred around the $1,991 price point, confirming its bullish momentum. As a result, Marzell predicts that Ethereum could experience a massive rally to $2,821, marking a whopping 41.69% increase from its breakout level. Currently, the price of Ethereum is trading at $2,008, already seeing a rise of 3.7% in the last 24 hours. If a rally to $2,821 occurs, it would represent a surge of approximately 40.5%. Featured image from Unsplash, chart from Tradingview.com

Mar 03, 2025 05:50

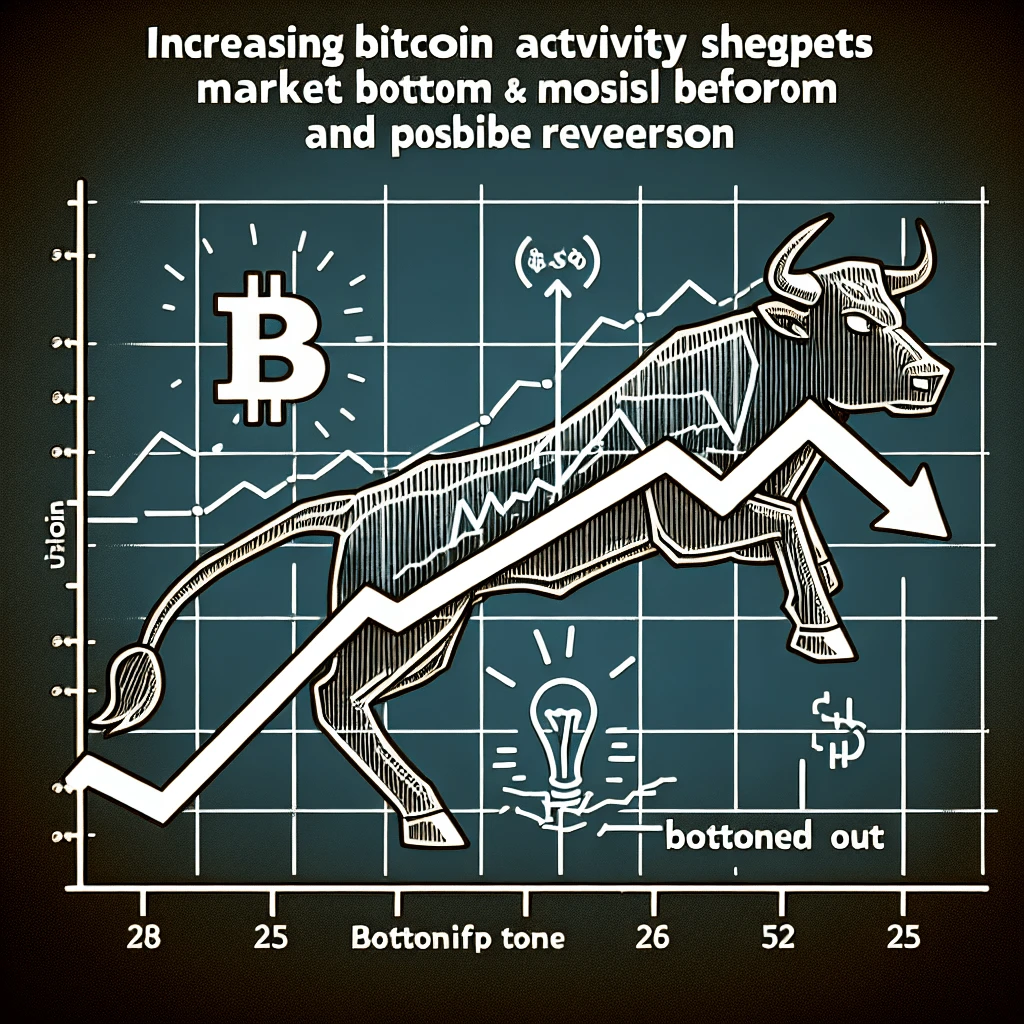
Increasing Bitcoin Activity Suggests Market Bottom and Possible Reversal

Bitcoin has reached a critical juncture as the number of active addresses on the network has dropped significantly. This decline may signal a potential turning point for the market. The latest data shows a sharp decrease in the number of unique addresses interacting with the Bitcoin blockchain. This decline is significant as active addresses are [...]

The post Increasing Bitcoin Activity Suggests Market Bottom and Possible Reversal appeared first on Crypto Breaking News.

Mar 20, 2025 12:05

Analyst Predicts XRP Price Could Rebound To $4, But Bulls Must Hold This Line

Crypto analyst CoinsKid has predicted that the XRP price could soon rally to $4, which represents a new all-time high (ATH) for the altcoin. He also warned that XRP bulls must hold the line to avoid a potential drop to as low as $1.64.  Analyst Predicts XRP Price Could Rebound To $4 In an X post, CoinsKid predicted that the XRP price could rebound to as high as $4 if the altcoin takes out the local January 2025 high, when it rallied to its current ATH at around $3.4. He added that XRP may go beyond this $4 target on the bull run in the crypto market. In the meantime, the analyst warned that XRP bulls must hold the line to avoid a significant correction. Related Reading: XRP Price Continuation After Crash Below $2.4? New Targets Emerge CoinsKid said that failure to hold the 20 Weighted Moving Average could spark a deeper correction for the altcoin, sending the altcoin to a minimal target of $1.64. The analyst went further to discuss XRPs current price action. He noted that the altcoin is missing a 5th wave from the July 2024 bottom.  The analyst further opined that the XRP price has been in a wave 4 irregular expanded flat ABC correction since December 2024. He revealed that XRP is currently holding the 20 Weighted Moving Average, which is a sign of strength from the bulls. However, he warned that they must continue to hold the line to avoid a drop to as low as $1.64. Meanwhile, he mentioned that the RSI and the retail top were the key data points that pointed to an XRP price correction back in December. As to what could spark this price rebound to $4, CoinsKid alluded to the global money supply, which shows that liquidity is entering the market soon after leaving in December.  $5 Is Also In Sight For The Asset Crypto analyst Dark Defender has also predicted that the XRP price could rally to as high as $5.85, although it would face significant resistance at $3.39, around its current all-time high. The analyst also highlighted $2.30 and $2.22 as the support levels that XRP needs to hold above as it eyes a rally to this $5 target.  Meanwhile, the analyst also revealed that the primary correction for the price on the weekly, daily, and 4-hour structure is over. He noted that there will be more minor ups and downs. However, Dark Defender suggested XRP was well primed for a bullish reversal. He added that the altcoin has started wave 1 with the aim of rallying to this $5 target.  Related Reading: Crypto Pundit Reignites $100 XRP Price Target, What You Should Know At the time of writing, the XRP price is trading at around $2.28, up in the last 24 hours, according to data from CoinMarketCap. Featured image from Adobe Stock, chart from Tradingview.com

Jun 29, 2023 01:20

Binance Abandons Planned Delisting of Some Privacy Coins in EU Markets

Cryptocurrency exchange Binance has reconsidered a decision to delist some privacy tokens in several European markets. The leading coin trading platform will continue to offer trading in these digital assets after revising their classification to comply with EU regulations. Binance to Continue Support for Certain Privacy Coins Despite Earlier Intentions to Remove Them The world’s

The post Binance Abandons Planned Delisting of Some Privacy Coins in EU Markets appeared first on BTC Ethereum Crypto Currency Blog.

Reversible transactions could mitigate crypto theft — Researchers

Author: Cointelegraph By Brian Quarmby
United States
Sep 26, 2022 08:25

Reversible transactions could mitigate crypto theft — Researchers

The proposal puts forward an “opt-in” token standard that would enable victims to report theft to a governance contract, with algorithms helping to identify and freeze ill-gotten gains.

Your Crypto Gateway

Claim 1,000
Free WCG Coins

World Crypto Global opens the door to digital freedom for everyone.
Manage your free WCG Coins securely—where simplicity meets global accessibility.

11 bn

FREE CRYPTO COINS

8.9 bn

AVAILABLE FOR RESERVATION

2.1 bn+

ALREADY ALLOCATED

× WCG Coin

🎉 Get 1,000 WCG Coins

No fees. No catch. Your crypto journey starts here.