South Korea fines Worldcoin for violating personal protection laws
Despite the regulatory hurdles, the projects WLD token surged 35% this week, from $1.60 on Sept. 19 to $2.16 on Sept. 26.
Loading
Welcome at World Crypto Global. This portal is packed with useful content and resources to built out your own crypto skills. WorldCrypto is a site member of Gabriel Vega Network.

Despite the regulatory hurdles, the projects WLD token surged 35% this week, from $1.60 on Sept. 19 to $2.16 on Sept. 26.
Although Bitcoin (BTC) on-chain health remains net positive, from a price perspective two crucial support levels must be maintained for a continued bullish uptrend, notes ARK Invest in its latest monthly report. Bitcoins Healthy On-Chain Metrics, What Does It Mean? In its report, ARK Invest posits that Bitcoin requires some upside if its market structure [...]
The post Bitcoin On-Chain Health Remains Net Positive: ARK Invest Report appeared first on Crypto Breaking News.
ETHs onchain and derivatives data are looking stronger even as macroeconomic data remains concerning.
Worldcoin expands its digital ID verification technology to Austria, offering residents in Vienna access to the World ID system with multiple locations throughout the city.
Amid recent market volatility, major cryptocurrencies like XRP have seen a wave of optimism among investors and traders as several crypto analysts continue to offer bold predictions regarding the altcoin. Even though XRP has not been able to witness a massive surge since its rally to its current all-time high in 2017, these analysts are confident that a similar move could take place in the ongoing bull cycle. Is XRP On The Brink Of Hitting A New All-Time High? In an audacious prediction, well-known crypto expert and trader, Xaif, delving into the current price action of XRP, has claimed that the crypto asset is preparing for a possible significant breakout, suggesting renewed strength for a major rally ahead. Xaif made the bold prediction after citing a bullish Symmetrical Triangle pattern on the altcoin‘s chart in the weekly timeframe. Related Reading: Can The XRP Price Cross $250? Crypto Analyst Predicts 42,000% Breakout Specifically, this pattern develops when an ascending line connecting the lows and a descending line connecting the highs converge. Also, they suggest a consolidation phase before a potential breakout on the upside or the downside. However, in this scenario, the crypto expert has identified an impending massive breakout for XRP on the upside, indicating a possible strong move for the digital asset in the upcoming days. Analyzing the magnitude of the breakout, Xaif has set his next price target for XRP at the pivotal $150 level in the next 6 months. Xaif’s prediction appears to have caused quite a frenzy in the community as crypto enthusiasts express their strong displeasure with the analyst’s bold forecast. Despite the nature of crypto assets to undergo wild price swings, these enthusiasts have criticized the analyst for his claims believed to impact the community negatively. While the community has slammed his projection, Xaif remains firm, noting that the token is a real-life utility and that the possibility of XRP handling transactions globally will catalyze this massive rally to the $150 threshold and even higher. However, Xaif, in another post, highlighted that XRP is stabilizing with a rising trendline between the $0,5650 support range and the $0.6450 resistance level. Meanwhile, a decline below $0.5650 or the trendline may indicate a negative trend, while a breakout above $0.6450 would suggest a bullish move. The Altcoin Needs To Break Through Key Resistance Levels Whether a move to the $150 level looms, XRP is poised for a bullish breakout. Another crypto analyst, Fiatleak, has forecasted a breakout for altcoin in the short term. Related Reading: Analyst Says XRP Price Will Rally 10,400% To $60, Heres When According to Fiatleak, the altcoin has been displaying strong signs of an upsurge for the past 2 days, due to growing market optimism and recent encouraging developments in the US Securities and Exchange Commission’s (SEC) legal battle with financial behemoth, Ripple. During the period, the analyst stated that the token has been fluctuating between $0.57 and $0.65, and other experts believe that if XRP can overcome significant resistance levels, it may soar to new all-time highs. Featured image from Adobe Stock, chart from Tradingview.com
Malaysia aims to tackle national challenges and unlock economic opportunities by adopting cutting-edge biometric verification technology.
Vitalik Buterin explores the complexities and potential benefits of decentralized biometric proof-of-personhood systems, touching on privacy, security, and centralization concerns. (Read More)
This episode of Decentralize with Cointelegraph explores how Worldcoin is pioneering the future of digital identity through its innovative use of biometric orbs and the revolutionary proof of personhood concept.
Worldcoin agrees to suspend activities in Spain until the end of the year or until a resolution is reached by the German data authority in ongoing data protection investigations.
According to the latest insight from a CryptoQuant analyst, Bitcoin might be poised for a notable price correction. This possibility of a price correction is based on major Bitcoin metrics such as the Adjusted Spent Output Profit Ratio (ASOPR), signaling a notable implication for Bitcoins trajectory. Understanding ASOPRs Role In Predicting BTC Corrections The ASOPR, [...]
The post Is Bitcoins Rally Over? New Insights from CryptoQuant Predict a Market Downturn appeared first on Crypto Breaking News.
An analyst has explained how Solana could be setting up for a major 53% move based on a Symmetrical Triangle pattern forming in its price chart. Solana Has Been Travelling Inside A Symmetrical Triangle Recently In a new post on X, analyst Ali Martinez discussed a pattern that has recently taken shape in Solana’s daily price chart. The technical analysis (TA) pattern in question is a “Symmetrical Triangle,” which, as its name implies, looks like a triangle. The triangular shape comprises two converging trendlines, with the upper line joining successive lower highs and the lower one connecting higher lows. A key feature of this pattern is that these lines approach each other at roughly the same slope (hence the “symmetrical” in the title). Related Reading: Why Is Bitcoin Stagnant Despite ETF Inflows? Report Answers Like other TA patterns, when the asset price consolidates in the region bounded by these trendlines, resistance will probably be at the upper level and support at the lower one. A break out of either of these lines can suggest a continuation of the trend in that direction. Naturally, a break above the triangle could be a bullish signal, while a decline under the pattern could lead to a bearish outcome. Similar to the Symmetrical Triangle, there are other triangle patterns in TA. A couple of popular ones include the Ascending and Descending Triangles. These patterns differ from the Symmetrical Triangle in that one of their trendlines is parallel to the time axis. Now, here is the chart shared by the analyst that shows the Symmetrical Triangle that the 1-day price of Solana has been trading inside over the last few months: As the above graph shows, Solana has been closing in at the tip of this Symmetrical Triangle pattern recently. As consolidation becomes tighter, a break out of the pattern naturally becomes more probable. As mentioned earlier, which of the two lines the breakout happens from sets the direction the potential price move would go. “Keep an eye on the $143 support and $178 resistance levels to gauge the direction of the SOL trend,” notes Ali. Related Reading: Is Bitcoin Overheated Right Now? This Metric Suggests No From the chart, it’s apparent that Solana is currently floating near the bottom line, so a retest could be coming up soon. If bullish momentum has to return for the coin, this retest must be successful. Moves resulting from a breakout of a Symmetrical Triangle may be the same length as the triangle’s height. In the case of this Solana Symmetrical Triangle, the height represents a price swing of 53%, so Ali believes that a breakout would also set the coin up for a move of a similar scale. SOL Price Solana hasn’t had the best times during the last few weeks, as its price is now down to $149. It remains to be seen whether a potential upcoming retest of the Symmetrical Triangle support would change the coin’s fate. Featured image from Shutterstock.com, charts from TradingView.com
Data of an on-chain indicator could suggest Bitcoin is currently not at a stage where its price would be at a significant risk of facing correction. Bitcoin 365-Day MA Growth Rate Is Sitting Below Historical Overheated Zone In a post on X, CryptoQuant author Axel Adler Jr has discussed about the recent trend in the “Growth Rate” metric for Bitcoin. The Growth Rate basically keeps track of the difference between the changes happening in the Bitcoin Market Cap and Realized Cap. The Market Cap here is naturally just the simple valuation of the cryptocurrency’s total circulating supply at the current spot price. The Realized Cap, on the other hand, is a bit more complex. Related Reading: Bitcoin Slips Under $67,000: Can BTC Rely On This Historical Support Again? The Realized Cap is an on-chain capitalization model for the asset that takes the “real” value of any coin in circulation to be the same as the price at which it was last transferred on the blockchain. As the last transaction of any coin was likely the last instance of it changing hands, the price at its time would act as its current cost basis. Since the Realized Cap sums up this price for all tokens of the asset, it essentially calculates the sum of the cost basis of each coin in the circulating supply. In other words, the Realized Cap measures the total amount of capital that the investors have used to buy their Bitcoin. The changes in the Realized Cap would, therefore, represent the capital inflows or outflows happening for the cryptocurrency. As the Growth Rate keeps track of how changes in the Realized Cap are reflecting in the Market Cap, it basically tells us about how reactive the market is being to capital flows. Now, here is a chart that shows the trend in the 365-day moving average (MA) of the Bitcoin Growth Rate over the last decade or so: As is visible in the above graph, the 365-day MA Bitcoin Growth Rate has been at positive levels since early 2023. When the indicator has green values, it means that the Market Cap is growing at a rate faster than the Realized Cap. At present, the indicator is sitting at the 0.001 mark, which is a relatively high level. Thus, it would appear that capital inflows have been rapidly driving up the price recently. Historically, during periods of euphoria in the market, where Market Cap has exploded relative to the Realized Cap, tops have become more probable to take place. Related Reading: Litecoin In Uphill Battle: Strong Resistance Might Block Recovery From the chart, it’s apparent, though, that the recent levels of the metric, although high, have still been below the 0.002 mark beyond which corrections have become likely in the past. The Bitcoin all-time high (ATH) back in March, which has continued to be the top for the rally thus far, had also occurred when the Growth Rate had surged above this level. BTC Price Bitcoin had slipped under the $67,000 mark yesterday, but the asset has since seen a recovery push that has now taken its price back above $69,300. Featured image from Dall-E, CryptoQuant.com, chart from TradingView.com
Bitcoin is outperforming the S&P 500 in Mike McGlones view, but it is weakening relative to gold, thus showing deeper market risks.
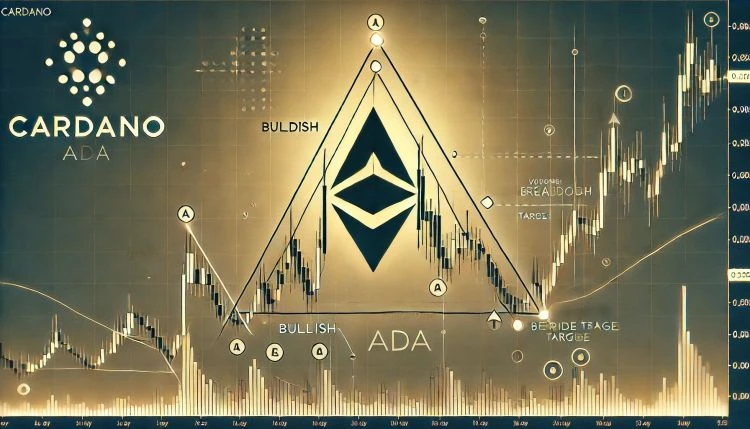
Cardano has surged more than 40% from its early April lows, signaling renewed bullish interest across the altcoin space. As the broader crypto market faces macroeconomic uncertainty and consolidates just below major resistance levels, ADA is now entering a critical phase. Price action remains range-bound, but sentiment is shifting as investors eye key technical patterns that could define the next move. Related Reading: $380M In Ethereum Leaves Exchanges In 7 Days Accumulation Trend Accelerates Top analyst Carl Runefelt recently highlighted that Cardano is consolidating within a symmetrical triangle on the 4-hour charta pattern often preceding sharp breakouts. This technical formation suggests that ADA is coiling for a decisive move, with bulls and bears battling for short-term control. The current range continues to tighten over the weekend, with volatility expected to return once a breakout direction is confirmed. A move above $0.7730 would indicate bullish continuation and potentially trigger another leg up toward the $0.85$0.90 zone. On the flip side, losing support near $0.6280 could spark a broader correction. As long as ADA holds its structure and stays above key moving averages, the bullish trend remains intact. Cardano Set For Breakout As Buyers Regain Short-Term Control Cardano is showing signs of strength despite trading in a tight consolidation range just below the $0.75 mark. After gaining over 40% from its early April lows, ADA has entered a crucial phase, with bulls gradually regaining control. The recent price action suggests that a breakout could be on the horizon, especially if ADA maintains its current support levels and builds further momentum. For the past few days, Cardano has traded sideways, struggling to break above the $0.75 resistance level. While this range-bound movement has frustrated some traders, it also reflects market stability, a common precursor to large directional moves. If bulls manage to push ADA above the $0.7730 resistance, a sustained rally could follow, potentially targeting the $0.85 and even $0.90 zones. Runefelt shared technical insights showing that Cardano is forming a 4-hour symmetrical triangle, a structure that often precedes sharp breakouts. The apex of the triangle is nearing, meaning a decisive move is likely within the next few sessions. The key bullish breakout level remains at $0.7730. On the flip side, a breakdown below the $0.6280 support would invalidate the bullish structure and could trigger a broader retracement. Overall, Cardano remains well-positioned for upside if it can reclaim resistance and confirm a breakout. Bulls will need to step in decisively to avoid a fakeout or extended consolidation. As the broader crypto market consolidates near highs, ADAs setup is one of the more promising among large-cap altcoins. The next move could set the tone for Cardanos trend in the weeks ahead. Related Reading: Cardano Whales Accumulated 410 Million ADA In April Breakout Coming? ADA Price Analysis: Consolidation Continues Cardano (ADA) is currently trading at $0.6963, consolidating just below the 200-day moving average (SMA) at $0.7766 and slightly under the 200-day exponential moving average (EMA) at $0.7113. This tight compression suggests a pivotal moment is near, especially as ADA attempts to hold its ground above the $0.67 short-term support. Price action on the daily chart shows that ADA has been coiling in a narrow range following its 40% rebound from April lows. Despite the broader market showing strength, ADA hasnt yet managed to break above the confluence of moving averages overheada necessary step to flip the market structure decisively bullish. The $0.77-$0.78 level remains the critical resistance to reclaim. A daily close above this zone could validate a breakout and push ADA toward the psychological $1.00 mark, last tested in early January. Related Reading: SUI Hype Grows As Price Action Points To A Rally: $4 Level In Focus Volume has been relatively muted during this consolidation, which typically precedes a major move. On the downside, losing the $0.67 level would be a bearish signal and could open the door to a retest of $0.62 or even $0.58. Featured image from Dall-E, chart from TradingView
The on-chain analytics firm Santiment has explained how this Bitcoin indicator has been one of the top leading indicators in the cryptocurrency market. Holdings Of Bitcoin Investors With At Least 10 BTC May Correlate To Price In a new post on X, Santiment has discussed about a metric that has historically been one of the top leading indicators in the sector. The metric in question is the total amount of supply held by the Bitcoin investors carrying at least 10 BTC in their wallets. Related Reading: How High Can Bitcoin Go Before A Top? Analyst Chimes In At the current exchange rate of the cryptocurrency, this cutoff is equivalent to around $683,000. As such, the investors holding sums of this scale or higher would be larger than the regular retail holders. Key groups such as sharks and whales fall in this range. These cohorts are generally considered to be influential beings, so their behavior can be worth keeping an eye on. While the 10+ BTC group wouldn’t solely include these large investors, the trend in its holdings would still at least in part encapsulate what these key holders would be doing. Now, here is a chart that shows the trend in the combined holdings of investors carrying balance in this range over the last few years: As displayed in the above graph, the Bitcoin supply held by investors belonging to this group has been going up recently, suggesting that accumulation has been occurring from the large holders. According to Santiment, there has historically been a pattern between the price and the behavior of the investors falling in this range. “When they accumulate, cryptocurrencies rise. When they dump, extended bear markets come,” explains the analytics firm. Instances of this trend are also visible in the chart. The supply held by this cohort started rising in October 2019 and kept up the rise throughout the bull run that followed in 2021. In February 2022, the behavior of these Bitcoin investors changed, however, as their combined holdings started heading down instead. This led into the bear market. The decline stopped after the FTX crash back in November 2022 and the holdings of these investors took to sideways movement in 2023. At the end of the year, another shift finally happened as the metric gained an uptrend. This accumulation likely kicked off because of the imminent spot exchange-traded fund (ETF) approval in January. These investors kept up this buying pressure post-approval as well, which all culminated into the rally towards the new all-time high (ATH). Related Reading: Is Mt. Gox A Worry For Bitcoin? Crypto Analyst Weighs In Despite the struggle that Bitcoin has faced recently, the trend in the indicator hasn’t flipped. As such, more bullish price action could be ahead for the asset, if historical pattern is to go by. BTC Price Bitcoin has fallen back to sideways movement recently, with its price trading around $68,300 at the moment. Featured image from Dall-E, Santiment.net, chart from TradingView.com
Glassnode launches a suite of new metrics to help traders identify local bottoms in a bull market. (Read More)
Amidst a significant surge displayed by Dogecoin (DOGE) recently, popular crypto analyst Crypto Daily Trade Signals has identified a symmetrical triangle pattern in the price movements of the crypto asset, indicating a possible continuation of the present rising trend. Based on the expert analysis, Dogecoin, which has attracted a lot of attention and interest from investors lately, may be preparing to build on its current momentum and make more gains. Significance Of Dogecoin Symmetrical Triangle Pattern A symmetrical triangle chart pattern is a consolidation phase that precedes a forced breakout or decline in price. A new bearish trend begins with a breakdown from the lower trend line, while a new bullish trend begins with a breakout from the upper trend line. Related Reading: Dogecoin Successfully Breaks Out Above $0.153, What Next? According to the analyst, the symmetrical triangle pattern presents a major obstacle for DOGE at the $0.1545 price level. At the same time, the 50-day Exponential Moving Average (EMA) continues to provide support at the $0.1513 level. Even though the current market price is above the 50 EMA and suggests a bullish bias, Crypto Daily Trade Signals noted that Dogecoin has to surpass the resistance level of $0.1595 in order to confirm that the upward trend is continuing. This perspective is further strengthened by the Relative Strength Index (RSI), which is currently above the 50 EMA and supports a purchasing trend. The post read: Dogecoin has formed a symmetrical triangle pattern, presenting a significant hurdle around the $0.1545 mark. Simultaneously, support persists around the $0.1513 level, reinforced by the 50-day EMA. The expert highlighted that DOGE is at a pivotal point around $0.15100 on the 4-hour chart, indicating a bullish momentum, and an immediate resistance at the $0.15950 mark. The first obstacle to be cleared is the immediate resistance at $0.15950, which is followed by the $0.16980 and $0.18440 levels. Although caution is advised if DOGE drops below the pivot point, the RSI’s current position indicates an opportunity for more profits. Thus far, the upward trend is supported by a firm base provided by the 50-day EMA around $0.15130. Meanwhile, on the negative side, $0.14270 provides immediate support, while $0.13240 and $0.12030 provide additional levels of support, with the RSI at 53, which denotes neutral conditions. Is $12 DOGE Possible? Crypto analyst Javin Marks has also shared insights on Dogecoin’s recent price action, predicting a potential massive rally to $12. According to the expert, based on previous breakouts and runs, DOGE has maintained its broken status once more. Related Reading: Is Dogecoin About to Take Off? Indicators Suggest Upward Momentum Ahead These runs have become bigger one after the other, and the last run recorded over 20,000% upsurge. Given the nature of the runs, Javon Marks anticipates the recent run, which might be in its early stage now, to be bigger than the last one. As a result, the expert experts DOGE to reach $12 or even higher following the run. Also, Marks noted that after the run has concluded, DOGE could see another massive rise of over 7,500%. Featured image from iStock, chart from Tradingview.com
Ethereum prices gained by over 4.6% in the past day to reach a peak of $2,634 before experiencing a slight retracement. In line with the bullish rhythm of the crypto market, the prominent altcoin has recorded significant price leaps in the past month, resulting in a total gain of 61.92% in this period. However, price patterns indicate that Ethereum is headed for a major encounter at $4,000, a price level with potential to neutralize or validate the current price uptrend. Related Reading: Ethereum Multi-Year Consolidation Could Spark A Parabolic Move Details ETH Must Surpass Long-Standing Resistance To Ignite Mega Rally In an X post on May 16, OKC partner and crypto analyst Ted Pillows highlighted an important price level for Ethereum amidst the ongoing bull trend. Notably, ETH has moved by over 60% in the past few weeks from $1400 to trade above $2,600. Based on the growing chart pattern and underlying market fundamentals, the altcoin is likely to maintain this uptrend in the short term. According to Ted Pillows, $4,000 can be described as a crucial price region for ETH bulls based on historical price data. Notably, Ethereum has been trading within a massive symmetrical triangle that began in Q3 2020 and has lasted over 1,500 days. The $4,000 price level currently sits just below the upper boundary of this triangle, representing a significant opposition to further price gains. In 2024, Ethereum popularly faced rejection thrice at the $4,000 price level, even amidst general market upswings, raising speculations over the altcoins long-term profitability. If the ETH bulls can sustain the current market demand, another encounter with this major resistance level is likely on the cards. To confirm the altcoins participation in a brewing crypto bull run and altseason, Ethereum must push past $4,000, flipping this price zone into an effective support level that could strengthen the current market structure with bullish targets set as high as $12,000. However, if ETH faces another rejection at this resistance zone, a price correction could occur with potential for price lows around $1,700 in line with the lower boundary of the symmetrical triangle. Related Reading: XRP Price Explosion To $5.9: Current Consolidation Wont Stop XRP From Growing ETH Institutional Interest Waxes Strong In other news, the ETH market continues to see significant market interest from institutional investors. In a separate X post, Ted Pillows reports that UK-based investment manager Abraxas Capital now holds 257,165 ETH, valued at $655 million, following a continuous accumulation spree over the past few days. Institutional investments are strong bullish signals of long-term profitability for the ETH market as they indicate a strong demand from these traditional financial institutions with relatively high amounts of liquidity. At press time, cryptos largest altcoin trades at $2,490, indicating a 6.95% gain in the past week. Featured image from iStock, chart from Tradingview
Worldcoin Foundation open sources a secure multi-party computation (SMPC) system to enhance biometric data protection and confirmed that users can now securely delete old iris codes.
HumanCode, in partnership with TON Society, has launched an innovative collaboration to bring AI-powered biometrics to the TON Ecosystem. Through a $5 million incentive program, users can now verify their digital identities securely within the TON Ecosystem using palm scanning technology. This initiative aims to provide secure digital identities to millions of Telegram users, ensuring convenience, privacy, and enhanced security. (Read More)
World Crypto Global opens the door to digital freedom for everyone.
Manage your free WCG Coins securely—where simplicity meets global accessibility.
FREE CRYPTO COINS
AVAILABLE FOR RESERVATION
ALREADY ALLOCATED

No fees. No catch. Your crypto journey starts here.