W o r l d . C r y p t o . G l o b a l

Loading

Welcome at World Crypto Global. This portal is packed with useful content and resources to built out your own crypto skills. WorldCrypto is a site member of Gabriel Vega Network.

Contact Info

CATEGORY: fibonacci retracement


May 15, 2025 12:05

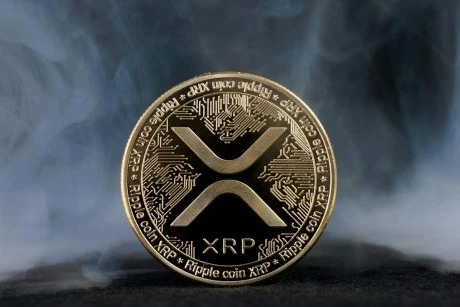
XRP Price Rejected At Resistance: Why $2.69 Holds The Key

XRP is facing a strong resistance level on its path to the $3 price level and above, with the past 24 hours witnessing some sort of rejection at this resistance level. XRP price action has gradually built momentum in May, leading to a sharp move toward the upper $2.60 range. On May 12, XRP briefly touched $2.63 before retreating slightly, now trading around $2.57. Directly ahead is the major resistance at $2.69, and technical analysis shows that this zone now holds the key to whether XRP can continue its march toward $3.00 or undergo a pullback for consolidation.  $2.69 Resistance Is Technical For XRP Price Crypto analyst CasiTrades has highlighted the $2.69 price point as an important resistance level for the XRP price moving forward. According to the analysts chart, which accompanied a post on social media platform X, this level represents the 0.236 Fibonacci retracement from XRPs all-time high and is a key level to watch for correction.  Related Reading: XRP Price Marks Confluence Support, Technical Indicators Put Next Stop At $3 Notably, this zone has led to multiple retracements since December 2024, with each attempt seeing sellers quickly step in to defend it. It even proved difficult to break when XRP broke to reach $3.3 in January, and an order block was created on the daily candlestick timeframe just before the ensuing rally above it. As noted by the crypto analyst, momentum indicators have remained relatively muted during XRP’s recent rally. The crypto has also completed what appears to be a full 5-wave Elliott count from the analyst. However, instead of a retracement, the price has pressed forward slowly alongside the rest of the crypto market. This slow, controlled push higher often signals strong underlying demand, strong trend, and heavy accumulation. As it stands, the only thing left to do is to see how the XRP price performs at the $2.69 resistance. Breakout Or Rejection: Two Opposite Outcomes With High Impact The analyst warns that the $2.69 level could be a final barrier before XRP is cleared for a run toward $3.00 and beyond. A confirmed breakout, ideally with a strong daily candle close above this level, would invalidate short-term bearish pressures and cause a run above this level. Related Reading: XRP Price Still On Bullish Path To $5 As Long As This Level Holds However, if $2.69 once again proves too strong for bulls to overcome, the altcoin may enter a temporary cooling-off phase. In this case, the next logical support level is around $2.30, which is close to the 0.382 Fibonacci retracement level. This is another breakout/rebound zone that could offer a healthy reset for the XRP price.  In either scenario, the price behavior at $2.69 is expected to set the tone for the rest of May and determine whether XRP can extend its 2025 bullish trend. At the time of writing, XRP is trading at $2.57, up 4% in the past 24 hours. Featured image from Getty Images, chart from Tradingview.com

Apr 10, 2025 12:05

Cardano Price Prediction: ADA Set To Crash To $0.4 After Correction To Liquidity Zone

Cardano (ADA) has found itself once again caught in a downward current as bearish sentiment grips the broader crypto market. The ADA/USDT pair on Binance is now painting a structure that many crypto analysts interpret as a warning sign of deeper losses ahead. According to a recent technical analysis on the TradingView platform, Cardano may be heading toward the $0.40 region after briefly correcting to an important liquidity zone. Bearish Market Structure And Liquidity Retest For Cardano Technical analyst RLinda noted that Cardano is currently under intense bearish pressure, describing it as being in a defined bear market. The analysis was made on the TradingView platform based on ADA/USDT price action on the 4-hour candlestick timeframe since early March. Related Reading: Cardano Price Could Be Set For 100% Rally As This Bullish Triangle Has Formed On The Daily Timeframe Notably, the chart shows that ADA traded within a period of sideways consolidation between March 11 and May 6, only to eventually initiate a pullback in what appears to be a classic liquidity retest move. This corrective move has now brought into focus the previously broken support zone around $0.63, which is now acting as resistance. RLinda highlights that this resistance level, combined with the 0.5 Fibonacci retracement zone, marks the upper boundary of what is now considered a selling zone. A retest of this support is, however, very possible, and the reaction here will determine if Cardano breaks down further. Breakdown Below $0.581 Could Open The Floodgates For ADA Cardanos price structure within the 4-hour candlestick chart shows lower highs and increasingly weaker bounces since March 26, reinforcing the bearish outlook. Interestingly, RLindas chart outlines a key trigger level at $0.581. A further breakdown is expected should ADA fail to hold the $0.581 support level, which has already served as a confluence area multiple times this cycle.  Related Reading: XRP, Cardano Command Inflows Amid Market Wide Selling Here Are The Numbers The next key support lies at $0.5092, but this level is not expected to provide significant strength. If this zone is breached, the analyst warns of a potential plunge into what she terms a zone of emptiness, where buying pressure might become non-existent. This emptiness of demand could send ADA plummeting further toward $0.4564, with an additional downside targeting $0.42 and potentially even $0.40. The analyst marks this area as the final destination for the current bearish phase unless broader market sentiment shifts dramatically.  Speaking of broader market sentiment, the crypto market was recently rocked by a surge in volatility triggered by conflicting reports about a supposed 90-day U.S. tariff suspension, but the White House quickly denied the rumour. The back-and-forth was enough to push the Bitcoin price down to $74,620 again by 9:30 EDT. Cardano’s price also dropped to $0.54 during the same time window. While ADA has since managed a mild recovery to the $0.5751 range, the bounce lacks conviction. The thin volume and absence of aggressive buying suggest the relief may be temporary and there are possibilities of more downside moves. Featured image from Adobe Stock, chart from Tradingview.com

Apr 06, 2025 12:05

Cardano (ADA) At A Crossroads As Fibonacci Level Indicates Potential Fall To $0.42

Market prices of Cardano (ADA) increased by over 3% on Friday amid a general bullish wave in the crypto market. However, this minor uptick only follows the largely negative performance earlier seen in the week.  Notably, popular crypto analyst Ali Martinez postulates the ninth-largest cryptocurrency could still experience steeper market losses if certain technical support fails to hold. Related Reading: Shiba Inus Shibarium Marks 1 Billion Transactions Milestone, But Why Is SHIB Price Still Struggling? Cardano Critical Support Break Could Lead To 36% Decline In a recent post on X, Martinez shares a cautionary insight on the current ADA market structure hinting at a potential price fall. Based on the Fibonacci retracement levels, Martinezs analysis indicates that Cardano still trades near a vital support zone despite recent gains. The Fibonacci retracement levels are horizontal lines commonly used to identify potential support and resistance zones. They are based on the Fibonacci sequence and are widely used in anticipating a price fall, gain, consolidation, or reversal. Looking at the chart below, ADA currently trades at $0.66 which is just above the 50% Fibonacci retracement level at $0.63 – a price zone that has acted as a resilient support level in recent weeks. Ali Martinez warns a daily close below $0.63 would signal a bearish shift in market control at this level paving the way for a further decline.  In this case, Cardano could fall to test the next significant support at the 61.8% Fibonacci retracement level around $0.53. If the selling pressure prevails at this zone, ADA prices could potentially slide to $0.42 representing the 78.6% Fibonacci retracement level. Related Reading: Chainlink Whales Dump Over 170 Million LINK In Three Weeks Selling Pressure Ahead? What Next For ADA? Cardano has struggled to maintain a prolonged bullish form after reaching a local peak of $1.30 in early December 2024. Since then, ADA prices have been in a corrective phase alongside the broader crypto market.  For ADA bulls, defending the $0.63 price level is crucial to sustaining any valid bullish outlook. However, a successful price reclaim of the $0.78-$0.80 price zone would signal an impending price rally and market rebound for the altcoin.  At the time of writing, Cardano trades at $0.66 as earlier stated. Amid recent gains, ADA is down by 5.00% on its weekly chart and 33.58% on its monthly chart reflecting a domineering bearish influence in recent weeks. Meanwhile, daily trading volume has gained by 19.56% in the past 24 hours indicating a rise in market interest. This development suggests the recent price rally might be sustainable due to a strong conviction among buyers. Featured image from CoinCentral, chart from Tradingview

Apr 06, 2025 12:05

XRP Bulls Eye $5 Target: Key Levels To Watch For Potential Breakout

Prominent market analyst and XRP enthusiast Egrag Crypto has rolled out a robust bullish prediction for the XRP market. Amid recent gains, Egrag Crypto postulates that XRP could surge to around $5 but not without resistance at certain price levels. At press time, the popular altcoin continues to trade around $2.12 reflecting a 3.99% gain in the past day amid a widespread price bounce in the crypto market. Related Reading: Shiba Inus Shibarium Marks 1 Billion Transactions Milestone, But Why Is SHIB Price Still Struggling? Fibonacci Levels Reveal $2.70 As Key To Major XRP Rally – Details In an X post on Friday, Egrag shares a positive technical outlook on the XRP market suggesting a potential massive price rally. This projected bullish run comes in multiple phases each barred by the clearance of a new resistance level. To show any signs of a price uptrend, the market analyst states that XRP bulls must first reclaim the $2.24 price level which aligns with the 21-day exponential moving average – a key trend indicator. Egrag explains that a daily close above this level would show sufficient base demand to kickstart a price recovery. Thereafter, another successful XRP daily price close above $2.30 would solidify bullish intent signaling a stronger upside continuation. This is because this price level represents the Fib. 0.382, which is a key retracement zone in technical analysis and typically acts as a resistance in a downtrend and support in an uptrend. Moving on, the next crucial resistance lies at $2.47 which aligns with Fib. 0.5. A convincing breakout above this price resistance zone would further increase the potential of a sustained uptrend. However, the strongest signal for a major rally and a new all-time high price will come only after XRP closes above $2.70 which coincides with both the yellow resistance line and the Fib. 0.618. Interestingly, Fib. 0.618, known as the golden ratio, is considered another important Fibonacci level that acts as support in an uptrend, and failure to break past which could signal a price reversal and halt the uptrend. However, if XRP successfully surpasses the listed resistance zones, Egrag forecasts a potential surge to $5.00 at Fib. 1.618, representing a 133% gain from the current market price and signaling strong potential for new price discovery. Related Reading: Is The Solana Bottom In? Experts Answer XRP Price Overview As earlier stated, XRP currently trades around $2.12 following the minor gains in the past day. Based on the daily trading chart, the altcoin remains far below its 100-day simple moving average suggesting a dominant bearish force. However, the Relative Strength Index (RSI) which stands at 42.69 moving upward, signals the potential for more price growth before a possible reversal. With a market cap of $123.06 billion, XRP continues to rank as the fourth largest cryptocurrency. Featured image from EXMO, chart from Tradingview

Apr 04, 2025 12:05

Cardano Price Breaks Out Of Prolonged Bearish Trend Toward $0.7, Heres The Next Target

After weeks of constrained price action and consistently lower highs, Cardano (ADA) appears to have finally broken free from its bearish grip. A recent analysis by crypto trader TehThomas on the TradingView platform confirms that ADA has broken out on the 4-hour chart, which may be marking the beginning of a more significant trend reversal.  ADA Breakout Reshapes Market Structure After Downtrend Cardano, like the rest of the crypto market, experienced a bearish trend in March. This bearishness was so intense that it saw the altcoin go from hoping to break above $1 in the first few days of March to the bulls working to prevent a close below $0.65 at the end of the month. Related Reading: Cardano Price Could Be Set For 100% Rally As This Bullish Triangle Has Formed On The Daily Timeframe In terms of price action, the Cardano price held up better than most large market-cap cryptocurrencies throughout this decline. Interestingly, technical analysis shows that Cardano’s price action in the last week of March played out in a descending channel formation, as highlighted by crypto analyst TehThomas. According to the technical analysis, which examined Cardano’s price action on the 4-hour candlestick timeframe, the descending channel that confined Cardanos price for the past several days was eventually breached in the first few days of April, allowing the asset to snap out of its minor corrective structure. Although limited to the 4-hour timeframe, this development could prove significant in shaping ADAs trajectory through April. If the momentum holds, more traders may start positioning for a continuation toward higher resistance levels above $0.7 that was easily broken in recent weeks. Golden Pocket And Fair Value Gap Converge: Target Zones To Watch The next challenge lies in reaching a zone that combines two significant technical features: the golden pocket and a Fair Value Gap (FVG). The golden pocket, located between the 0.618 and 0.65 Fibonacci retracement levels, is commonly seen as a strong resistance zone, especially following a breakout. In the case of Cardano, TehThomas identified the golden pocket lying around $0.72. This level here could pose a resistance for any uptrend above $0.70. The $0.72 region is also highlighted by a Fair Value Gap (FVG), created by the quick price fall in March that left behind an unbalanced area on the chart. According to TehThomas, price tends to revisit these imbalances to fill them, making this confluence a magnet for short-term action. Related Reading: Cardano Price Prediction: Analyst Says $0.8 Might Not Come Again If This Wedge Breaks Out Liquidity will likely be clustered here as well, meaning that Cardano could face some volatility as it approaches it. If bulls can break through this zone with conviction, it could open the path to above $0.7. However, if the price stalls or rejects, the cryptocurrency may pull back to retest the breakout point at $0.65 before attempting another push. Interestingly, this has been the case in the past 24 hours. Featured image from iStock, chart from Tradingview.com

Apr 27, 2025 02:30

Ripple (XRP) at a Crossroads: Hold 0.702 Fib or Risk a Sharp Drop to $1.25

Ripple (XRP), the fourth-largest cryptocurrency by market cap, is at a critical juncture as technical analysis points to a potential short-term correction. XRP is trading at $2.19, with a 24-hour trading volume of $3.2 billion, according to CoinMarketCap. The token has seen a 5.7% increase over the past week, reflecting strong momentum fueled by recent […]

Apr 19, 2025 12:05

Solana Price Enters Consolidation Trend Above $130 That Could End In A Breakout

Solana is showing signs of pre-breakout behavior as it consolidates below an important price threshold. According to a new technical analysis shared by RLinda on the TradingView platform, the $136 level is currently a decisive resistance point, and Solanas current trading behavior suggests that a move above this level could ignite a fresh bullish push even as the global market situation is bearish. Solana Finds Stability After False Breakdown The current structure of Solanas price chart reflects a notable recovery after what the analyst described as a false breakdown below the range support zone. This false breakdown refers to the price crash between the last week of March and the first week of April, during which the Solana price briefly broke below $100. Notably, this break below $100 came as an extension of a decline run after a break below a key support range between $115 and $108. Related Reading: Solana Price To Drop To Double Digits? Major Levels To Watch For Entries After briefly dipping below key support, Solana quickly rebounded, and the market responded with renewed buying pressure that sent its price back above $130. However, this push is starting to slow down, with resistance at $136 and a consolidation phase between $130 and $136.  This consolidation range is proving to be an important zone for Solana’s bullish potential going forward, according to RLinda. This behavior is further reinforced by liquidity dynamics. The analyst highlights a liquidity imbalance created by the recent false breakdown, which could favor upward price movement as Solana bulls seek to reclaim the upper zones above $136.  A sustained move above $136 could serve as the initial trigger for a breakout, potentially shifting short-term market sentiment in Solanas favor. If this scenario unfolds, the move would provide technical confirmation of growing strength among buyers. This bullish potential is notable, even as RLinda noted that the global market situation is bearish. Breakout Above $136 Could Unlock Higher Price Targets For Solana Speaking of the bearish global market situation, RLindas analysis categorizes the local Solana setup as neutral, indicating that the price is in a range rather than exhibiting a definitive trend. Crypto market dynamics also lend weight to the bullish outlook for Solana. Bitcoin, the dominant force in the crypto market, is itself undergoing consolidation and has been highly correlated with Solanas movements in recent weeks. Should Solana manage to close and consolidate above $136, the chart opens up to a sequence of local targets, with the $140, $147, and $152 levels becoming the following areas of interest. Related Reading: Ethereum, Solana And Cardano Trend After Crypto Crash Heres What You Should Know At the time of writing, Solana is trading at $ 134.80, up 0.5% in the past 24 hours and 15.6% in the past seven days. Even if the outlook is bullish, minor corrections may still occur as this process unfolds. In such a scenario, the Fibonacci 0.5 retracement, located around $125.28, will provide a cushion for price corrections. As such, any short-term dip from the current price level may be met with strong support and accumulation at the Fib retracement. Other support levels are at $129, $123, and $111. Featured image from Adobe Stock, chart from Tradingview.com

Apr 15, 2025 12:05

Ethereum Price Threatened With Sharp Drop To $1,400, Heres Why

Ethereum might be on track to facing renewed pressure, according to an interesting technical outlook. Despite short bursts of recovery attempts, the broader market structure is still trying to flip in favor of bulls, but price movement shows that the bears are still in control. Notably, a recent technical analysis posted by crypto analyst Youriverse on the TradingView platform highlights a potential sharp drop in the price of Ethereum towards $1,400 if the current downward trend continues. Strong Rejection From Key Fibonacci Zone Hints At Persistent Resistance Technical analysis shows that the Ethereum price chart is currently characterized by a noticeable Fair Value Gap (FVG) on the 4-hour timeframe. This interesting gap was left behind after a steep 10% drop last Sunday, marking a strong area of seller dominance. Related Reading: Ethereum Price Looks Set To Crash To $1,000-$1,500, But Can It Fill The CME Gaps Upwards To $3,933 This gap represents a zone of clear imbalance where selling activity outweighs buying pressure and has influenced Ethereums price action throughout the past seven days. Earlier last week, Ethereum retraced into this gap, reaching the midpoint, but was met with swift rejection. This swift rejection showed the intense selling pressure present within this Fair Value Gap.  Interestingly, the Ethereum price has returned to this Fair Value Gap again, and another rejection here could send it back to a bottom below $1,400. Furthermore, Ethereum is trading within an area identified as the golden pocket of the Fibonacci extension indicator, which is drawn from the $1,383 bottom on April 9. Unless price action breaks decisively above this level and heads toward the next Fib level of 0.786 at $1,724, there is still a risk of a significant rejection that could lead to further downside below $1,400. Stochastic RSI Weakness Suggests Possible Downturn Ahead For Ethereum In addition to the Fair Value Gap and Ethereums struggle within the golden pocket of the Fibonacci retracement zone, the Stochastic RSI is now introducing another layer of bearish pressure to the current outlook. This momentum oscillator, which measures the relative strength of recent price movements, is approaching the overbought region on the daily timeframe.  Related Reading: Ethereum Pain Is Far From Over: Why A Massive Drop To $1,400 Could Rock The Underperformer Ethereums approach of overbought zone with the Stochastic RSI is due to inflows that have pushed the cryptos price from the $1,383 bottom on April 9. Now that the Stochastic RSI is moving into the overbought zone, it adds to the bearish outlook that it could reject at the Fair Value Gap and start a new downside correction very soon.  So far, the Ethereum price was rejected at $1,650 in the past 24 hours, which further supports the bearish continuation thesis. If the selling pressure builds again, as suggested by both the weakening RSI and persistent resistance at the Fair Value Gap, the analyst warns of a breakdown that could drag the price to as low as $1,400, or even lower. At the time of writing, Ethereum is trading at $1,627. Featured image from Unsplash, chart from Tradingview.com

Apr 12, 2025 12:05

XRP Price Flashes Symmetrical Triangle From 2017, A Repeat Could Send It as Flying To $30

The XRP price may be gearing up for a historic breakout as a long-term Symmetric Triangle pattern from 2017 resurfaces on the charts. If history repeats and a similar explosive move follows, a crypto analyst predicts XRP could skyrocket to an eye-popping $30.  XRP Price Triangle Pattern Signals Breakout Above $30 A new technical analysis by Egrag Crypto, a crypto analyst on X (formerly Twitter), has stirred excitement among XRP supporters, suggesting that the digital asset may be on the brink of a historic price surge and that XRP could jump from its current market value of $2 to reach $30 soon. Related Reading: Crypto Pundit Reveals What Will Happen If XRP Price Does Not Break $2.3 While this figure may seem rather ambitious, Egrag Crypto has identified a massive Symmetrical Triangle formation on XRPs monthly chart. Interestingly, the analyst has revealed that this pattern is strikingly similar to one that preceded XRPs legendary 2,600% rally in the 2017 bull market.  In the 2017-2018 bull market, XRP had surged to an all-time high of $3.84 in just months. Now, after years of tightening price action within a giant Symmetrical Triangle, the altcoin appears to be breaking out once again, and this time, the analyst predicts that the upside could be even more explosive.  According to Egrag Cryptos chart, if the asset mirrors its previous 2,600% triangle breakout, it could soar from the breakout zone around $1.20 to as high as $32.36. Notably, XRPs Symmetrical Triangle formation is a classic consolidation pattern that usually results in a bullish surge in the direction of the prevailing trend.  Currently, XRPs all-time high is $3.84. A potential surge to $32.36 would represent a whopping 741.6% increase, propelling its price to a level far exceeding its historical peak.  Bullish Pennants Strengthen Symmetrical Triangle Forecast Egrag Cryptos bullish forecast for XRP is supported by a textbook diagram comparing bullish pennants and symmetrical triangles, both of which point to double target zones once a breakout occurs. The pattern suggests that once the altcoin escapes its multi-year consolidation, the analysts projected rally may play out in three stages: an initial pump, followed by a retracement, and a second explosive move.   Related Reading: XRP Price Eyes 20% Move With Golden Pocket Appearance The XRP price chart shows a lower target, around $3.52, which aligns with the 1.0 Fibonacci retracement level. This indicates that the token could see a temporary rebound to 3.52, followed by a short-term pullback to the triangle breakout point at $1.20, before ultimately bouncing toward the projected $32.36 target.  Notably, this movement aligns with XRPs current market structure, where it has maintained long-term support and is now showing signs of upward momentum. While historical price patterns offer insights into potential moves, the predicted rise to $32.36 is uncertain, given the magnitude of such a rise. Featured image from Adobe Stock, chart from Tradingview.com

Mar 12, 2025 12:05

XRP Price Face Major Resistance At $2.9, Why This Analyst Believes $20 Is Still Possible

Crypto analyst ElmoX has asserted that the XRP price is still bullish despite the recent crypto market crash. His analysis revealed that XRP is set to face major resistance at $2.9, although he is confident that the crypto will eventually break this resistance and rally to as high as $20.  XRP Price Faces Resistance At $2.9 But Could Still Rally To $20 In a TradingView post, ElmoX outlined two scenarios for the XRP price as it eyes a rally to $20, although he noted that the crypto will retest the major resistance at around $2.92 either way, on its way to a new all-time high (ATH).  For the first scenario, the analyst stated that XRP would break this resistance and then skyrocket to $20.  Related Reading: XRP Price Can Fall Further To $1.5 If This Level Fails To Hold Meanwhile, in the second scenario, ElmoX stated that the XRP price could face another rejection, sending it below the $1.5 level before it witnesses a bullish reversal and rallies to a new ATH. The analyst revealed that he is betting on this second scenario since there is usually a swift crash before an impulsive move to the upside.  ElmoX remarked that the XRP price has barely corrected, which is also why he believes there could still be a massive crash before a rally to a new ATH. Meanwhile, the analyst didnt provide an exact timing for the potential price correction and subsequent rally to a new ATH and the $20 price target.  Instead, he simply told market participants to be patient. He further warned that the XRP price might sit in price discovery until at least mid-July. His accompanying chart showed that XRP will first drop to as low as $1.20 before it witnesses an impulsive move to as high as $20.  The Altcoin Records A Bullish Close In an X post, crypto analyst CasiTrades noted that although the XRP price briefly broke below the $2 trendline, the candle closed back above this trendline, reclaiming the consolidation range. She remarked that this is exactly what bulls needed to see. However, the analyst added that a confirmation is needed with XRP holding the range between $2 and $2.03 as support.  Related Reading: XRP Price Continuation After Crash Below $2.4? New Targets Emerge CasiTrades stated that a breakdown from consolidation usually leads to further downsides, but the XRP price managed to recover the level quickly, showing that buyers are stepping in. She also noted that the bullish divergence is still holding up to the 1-hour RSI even after the dip with selling pressure weakening, which suggests a shift in momentum is possible.  If the XRP price holds the support between $2 and $2.03, CasiTrades predicts that the crypto could bounce and rally toward $2.25 and $2.70. On the other hand, if XRP loses this level, she stated that the next major support sits at $1.90 which is the 0.5 Fibonacci retracement level. Meanwhile, there is also the possibility that XRP could drop to the 0.618 Fib retracement level at $1.54.  At the time of writing, the XRP price is trading at around $2.10, down over 4% in the last 24 hours, according to data from CoinMarketCap. Featured image from Adobe Stock, chart from Tradingview.com

Feb 10, 2025 12:05

XRP Bull Targets $2.80 Breakout Key Levels To Consider

According to data from CoinMarketCap, XRP recorded a substantial price decline in the past trading week losing 16.78% of its market value. Currently, the prominent altcoin finds itself in a consolidation zone potentially gathering momentum for its next breakout. Related Reading: Dogecoin Price To $1, XRP To $6, And Solana To $1,000? Pundit Says Youre Not Bullish Enough XRP Price At Crucial Juncture In a recent X post, popular digital asset expert Egrag Crypto shared a technical analysis of the XRP market presenting both possible bullish and bearish scenarios. This analysis was based on Fibonacci retracement levels which identifies potential support and resistance levels and the 21-day exponential moving average which smoothens out price data giving more weight to recent prices. According to Egrag Crypto, XRP is expected to range between $2.27 (Fib 0.382) and $2.45 ( Fib 0.5). However, there is potential for prices to swing within a wider boundary of $2.06 (Fib 0.236) – $2.65 (0.618). Notably, the altcoin gained by 1.67% in the past day. However, a daily price close above the 21 EMA which is currently at $2.70 is crucial in confirming any uptrend.  Interestingly, if market bulls are able to force a strong close above $2.80 (Fib 0.702), this would suggest a major bullish signal indicating the current XRP buying pressure is sufficient to break higher resistance levels. On the other hand, Egrag Crypto warns that traders must avoid any price fall to $1.77 which may not necessarily invalidate the current bullish structure but would suggest rising bearish pressure. Related Reading: Altcoins Season: Recent Crypto Dip Shows Decline May Be Over And Bulls Are Taking Charge XRP Market Overview  At the time of writing, XRP trades at $2.49 after a 4.43% increase in the last 24 hours as previously stated. However, the asset’s trading volume is down by 56.85% indicating a lack of interest and uncertainty in the market. However, considering XRP’s overall bearish form in the last seven days, a fall in trading volume may also suggest reduced selling pressure pointing to a potential reversal. Generally, XRP investors remain bullish on the assets prospects driven by several factors but most notably by the potential of an XRP Spot ETF. In the past week, there were significant developments on that front as the Chicago Board Options Exchange filed 19b-4 applications with the US Securities and Exchange Commission (SEC) seeking to list and trade the XRP spot ETFs proposed by WisdomTree, Bitwise, 21 Shares, and Canary. Once the SEC acknowledges receipt of these applications, the US regulator is granted a 45-day window – with potential extensions of up to 240 days – to assess and make an approval decision on the proposed ETFs.  Featured image from Trackinsight, chart from Tradingview

Feb 05, 2025 12:05

Bitcoin Price Crash To $91,000 Termed Major Bear Trap As Optimism Returns To The Market

Crypto analyst Merlijn has described the Bitcoin price crash to $91,000 as a major bear trap as optimism returns to the market. The flagship crypto had dropped to this level following a wave of weekend sell-offs but has since recovered above the psychological $100,000 level.  Bitcoin Price Crash To $91,000 Termed Biggest Bear Trap In an X post, Merlijn described the Bitcoin price crash to $91,000 as the biggest bear trap of this cycle. The analyst noted that this happened in the 2017 and 2021 bull runs and has now occurred in this 2025 bull cycle. He is optimistic that Bitcoin and other crypto are well primed to rally to new highs, remarking that every major bull run had a final bear trap before sending it.  Related Reading: Bitcoin Price Aims For $150,000-$170,000 With Wave Formation, Here Are The Details The Bitcoin price had crashed to $91,000 following a wave of sell-offs, which was sparked by Donald Trumps tariffs on Mexico, Canada, and China. This raised concerns about a trade war as Mexico and Canada moved to announce tariffs on imports from the US in retaliation. However, this turned out to be a bear trap, as BTC quickly reversed its weekend loss on Monday.  The Bitcoin price reclaimed $100,000 as the US, Mexico, and Canada agreed to a one-month pause on these tariffs. The rally to the psychological $100,000 level has again sparked optimism in the crypto market, especially with altcoins rebounding alongside the flagship crypto. Merlijn warned market participants that they can either choose to get shaken out or be positioned for the biggest move yet. Merlijn also shared a chart that showed that the bull cycle is far from over. Based on the chart, the Bitcoin price will still go through the renewed optimism, FOMO, and Euphoria phase before it tops in this cycle.  What’s Next For BTC? In an X post, crypto analyst Rekt Capital stated that the Bitcoin price needs to record a daily close above $101,000 and retest it successfully to reclaim it into support. He added that a successful reclaim of this price level could lead to an uptrend continuation, with BTC rallying to around $103,000. Based on the accompanying chart he shared, the next crucial resistance for the Bitcoin price is around $106,148. Related Reading: Bitcoin Upper Band Moves Above $105,400 Where Price Is Headed Next Crypto analyst Titan of Crypto asserted that Bitcoins bull market is still intact. According to him, the bullish trend remains valid as long as BTC holds a monthly close above the 38.2% Fibonacci retracement level. In an X post, he highlighted a continuation pattern that could send the Bitcoin price as high as $117,000 in the short term.  At the time of writing, the Bitcoin price is trading at around $99,500, up over 5% in the last 24 hours, according to data from CoinMarketCap. Featured image from Unsplash, chart from Tradingview.com

Feb 29, 2024 12:05

Analyst Labels Bitcoin Rally Strongest Pre-Bull Cycle Yet

The entire cryptocurrency space is fueled with excitement as the price of Bitcoin rallied today, demonstrating immense resilience, reaching the $59,000 threshold and even further in the past 26 months. Bitcoin Rally Kicks Off The Strongest Pre-Bull Cycle So Far Bitcoin is currently in the limelight as the crypto asset continues to rally, leading to several analysts identifying the surge as the start of the “biggest bull cycle ever.” Analyst and trader Crypto Jelle has labeled the recent uptick as the “strongest start to a new cycle” as his analysis examines the strength of BTC‘s surge. Related Reading: Bitcoin Fast Approaching $60,000 As BTC F&G Index Hits Extreme Greed Details Jelle claims this resulted from Bitcoin’s latest “break out from the 0.618 Fibonacci retracement.” According to the analyst, “this marks the first time” the asset has made this kind of move “before the Bitcoin Halving event happens.” He also claims that with the ongoing rally, it seems like the market is “in for a new regime,” he believes things will play out “differently” in the market from how they usually do. The post read: This is the first time Bitcoin breaks that 0.618 Fibonacci retracements before the halving event even takes place. By far the strongest start to a new cycle, ever. Looks like we are in for a new regime, where things work a little different than how they used to. The analyst claims that a shift in the narrative is ushering in a “new era of dynamics in the cryptocurrency landscape.” As a result, “exciting moments await” the space in the future. Crypto Jelle declared that nothing can stop Bitcoin at the moment. “With BTC rising by another 2% in the past few hours, there seems to be no stopping it right now,” he stated. Additionally, most of yesterday’s gains occurred outside the Exchange-Traded Funds’ trading hours. However, the analyst is waiting to see if they will “force boomers to pursue price.” BTC ETFs See Massive Inflow Research company BitMEX reported that Bitcoin Spot ETFs have seen increased adoption, witnessing a massive surge in daily inflow. Data from the platform shows that ETFs have witnessed a significant inflow of 10,167 BTC valued at $576.8 million. Related Reading: Bitcoin Spot ETFs: Issuers Set New Record As Weekly Inflows Cross $2.2 Billion BitMEX underscored that Blackrock’s iShares BTC ETF (IBIT) made up $520 million of the total inflow. Consequently, this marks the highest inflow the company has seen since the products were approved.  So far, Blackrock’s asset holdings have risen to over 141,000 BTC, and its net inflow sits above $6.5 billion. Currently, Bitcoin is trading at $59,254, indicating a rise of over 4% in the past 24 hours.  Featured image from iStock, chart from Tradingview.com

Feb 27, 2025 12:10

SUI Uptick Sparks Hope, But Is This Fleeting Recovery?

Sui (SUI) is showing signs of a potential rebound as its price climbs above the $2.80 mark, sparking optimism among traders. After experiencing a period of downside pressure, the cryptocurrency is attempting to reclaim lost ground, suggesting that bullish momentum may be building. This recovery comes at a critical juncture as maintaining support above this level could pave the way for further upside movement.  The rally has drawn attention to whether SUI is gearing up for a more sustained recovery or if this surge is merely a short-lived reaction before another downward move. Despite the optimism, the broader market remains highly volatile, and SUI still faces key resistance levels that might determine the strength of this uptrend. SUI Price Attempts Recovery SUIs price faced rejection after attempting to push higher, signaling possible weakness in the current recovery attempt. After climbing to the 50% Fibonacci retracement level at $3.079, the cryptocurrency struggled to sustain its upward momentum, encountering resistance that prevented further gains.  Related Reading: SUI Bearish Grip Tightens As Price Eyes $2.8 Retest Amid Market Pressure This rejection has triggered a fresh decline, indicating that sellers are defending key levels. As a result, the asset has started to lose traction, with bearish pressure mounting again. The decline could accelerate, leading to a deeper retracement If the price fails to find support at nearby levels. Furthermore, SUI is still struggling to gain bullish momentum as it trades below the 100-day Simple Moving Average (SMA) and remains under pressure from a key bearish trendline. Typically, this indicates that sellers are still in control, preventing a breakout toward higher levels. A decisive move above these resistance points could signal a trend reversal, but failure to do so may result in more downside pressure. Technical Indicators: A Mixed Picture From a technical perspective, the recent recovery above $2.8 is a promising development. SUIs Moving Average Convergence Divergence (MACD) shows early signs of a bullish crossover, which could signal upside potential if the momentum continues. Related Reading: SUI Skyrockets: Bullish Momentum Drives Push Toward $6 However, challenges remain with the $3.5 level cited as a significant resistance zone, and a failure to break through hints at renewed selling pressure. Additionally, trading volumes are improving, but are still below their peak levels. In conclusion, SUI must overcome two major hurdles to confirm a meaningful recovery: the 100-day SMA and the bearish trend line. A break above these levels, accompanied by strong volume, might open the door to higher price targets, including $3.0 and beyond. On the other hand, a failure to hold above $2.8 sparks a retest to lower support levels, reigniting the downtrend. Featured image from YouTube, chart from Tradingview.com

Jan 21, 2025 12:05

This Analyst Correctly Predicted The Bitcoin Price Crash To $99,000, Heres Whats Supposed To Happen Next

A crypto analyst who accurately forecasted the Bitcoin price crash to $99,000 has now made another notable prediction for the pioneer cryptocurrency. While the analysts previously bearish projection was driven by volatility and waning market demand for Bitcoin, his new forecast sees the cryptocurrency skyrocketing to new highs above $110,000, fueled by its recent bullish performance.  Bitcoin To Retest Key Support As Next Move From a technical perspective, TradingView crypto analyst R.Linda has pinpointed the range between $102,500 and $100,000 as a critical support zone for Bitcoin. The analyst highlights that if Bitcoin can retest and maintain a price above this zone, it could set the stage for a potential market rally to new ATHs of $120,000 in the mid-term.  Related Reading: Bitcoin Upper Band Moves Above $105,400 Where Price Is Headed Next According to CoinMarketCap, Bitcoin is currently trading at $108,594, experiencing a dramatic 4.65% rise in the past 24 hours. R. Linda suggests that this recent price rally may result from strong accumulation and growing investor confidence. Given Bitcoins growing momentum, the TradingView market expert has set new resistance levels at $103,600, $105,700, and $107,500. She believes a successful breakout from these levels could propel Bitcoin to retest new bullish targets between the $108,000 and $112,000 range.  Despite correctly predicting the recent Bitcoin crash to $99,000, the analyst believes another failure to hold above the $100,000 mark could temporarily stall a price rally, with the possibility of a more resounding crash. R. Linda stated that Bitcoin may form a correction pattern, potentially experiencing a slight pullback to the 0.5 Fibonacci retracement level near $100,000, or even as low as $97,500. Moving ahead, Bitcoins overall trend remains bullish as long as its price quickly recovers from any projected declines and stays above critical support levels. The $102,500 level is highlighted as a pivotal price point expected to trigger Bitcoins bullish continuation.  Bitcoins Current Market Condition  According to R. Linda, Bitcoin surprised the market again by rallying more than 18% over the past week after surpassing previous support zones. The flagship cryptocurrency quickly reignited previous bullish sentiment after retesting the panic and risk zone when selling pressures significantly rose. Related Reading: Pundit Says Bitcoin Price Will Break Above $100,000 If This Happens This sharp price increase has been attributed to technical, fundamental, and macroeconomic factors. R. Linda has stated an increase in activity from institutional investors and the major players in the space. She suggested that Donald Trumps inauguration as the President of the United States (US) and speculations about favorable crypto policies under his administration have also significantly contributed to Bitcoins recent rebound.  The bullish combination has solidified Bitcoins position, creating a strong momentum that has attracted new buyers and increased institutional interest from players globally. R. Linda highlights that Bitcoins price action in the past three days suggests a strong consolidation and accumulation phase, where buyers aggressively defend the price area between $91,000 and $89,000. Featured image from Unsplash, chart from Tradingview.com

Your Crypto Gateway

Claim 1,000
Free WCG Coins

World Crypto Global opens the door to digital freedom for everyone.
Manage your free WCG Coins securely—where simplicity meets global accessibility.

11 bn

FREE CRYPTO COINS

8.9 bn

AVAILABLE FOR RESERVATION

2.1 bn+

ALREADY ALLOCATED

× WCG Coin

🎉 Get 1,000 WCG Coins

No fees. No catch. Your crypto journey starts here.