W o r l d . C r y p t o . G l o b a l

Loading

Welcome at World Crypto Global. This portal is packed with useful content and resources to built out your own crypto skills. WorldCrypto is a site member of Gabriel Vega Network.

Contact Info

CATEGORY: fibonacci levels


May 28, 2024 12:05

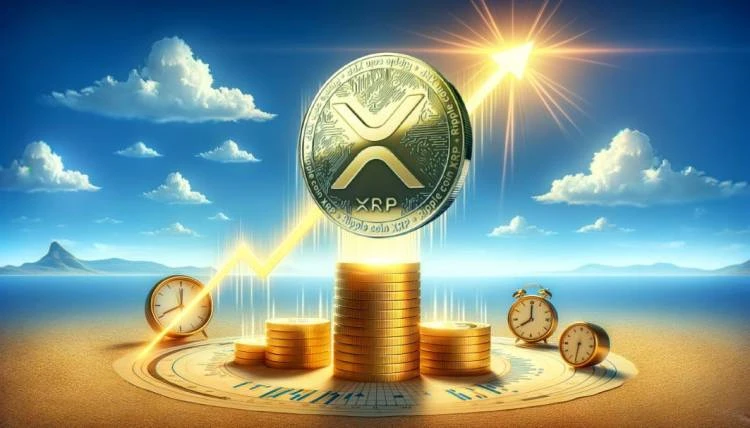
XRP Bullish Outlook: Analyst Predicts Mega Run On The Horizon

In a strikingly optimistic forecast amidst favorable market conditions, cryptocurrency analyst and trader Edrag Crypto, has provided a bullish review for XRP, predicting that a massive run for the digital asset could be on the horizon. The analysis explores a confluence of positive market indicators and trends that demonstrates the potential for XRP to attract significant price surges and gains, positioning the coin as a promising asset in the ever-evolving world of cryptocurrency. Edrag Crypto’s bullish prediction for XRP is based on a Genuine Wake-Up line previously introduced by the expert, divided into two distinct sections, such as Break-out and Atlas Line. XRP Poised For Substantial Growth The analyst has expressed that while this wake-up line saw a successful breakout last year, it could not reach the heights anticipated by the analyst then. “Many moons back, I introduced the ‘Final Wake Up Line,’ which saw a breakout in July 2023. Yet, it didn’t quite soar to the heights we hoped for,” he stated. Related Reading: XRP Declares War On Uncertainty: Analyst Predicts Breakout Fueled By Regulation However, Edrag Crypto spotted a new development on XRP’s chart two weeks ago, which he indicated as a white triangle. According to the analyst, highs from 2021 are being incorporated into the white triangle.  At that time, for XRP to witness a complete upward swing, it needed to break through the Genuine wake-up line with absolute conviction and then retest. Consequently, Edrag Crypto urged the community to remain firm, putting his wave 1 target at $7.5 and wave 3 at a 3-digit target, within the Macro wave 3. Presently, addressing the break-out aspect, the analyst has noted that the white triangle break-out is in perfect alignment with the Fibonacci 0.702 – 0.786 levels and his previous charts. It is expected that the measured move will be between $1.2 and $1.5, while the crucial break-out point is closer to $0.70 or $0.75. Due to this, Egrag Crypto affirms that XRP will see a breakout from the point in the upcoming weeks. Despite the possibility of a retest of the breakout, the expert believes that a mega run for the crypto asset is imminent. The Atlas Line Delving into the Atlas Line aspect, Egrag Crypto underscored XRP’s resilience in this area. According to the analyst, the asset is dominating the atlas line with a solid grip like a boss. Related Reading: Ready For Liftoff: XRP Price Primed To Skyrocket Before November He further pointed out a quick timeframe analysis revealing resistance at $0.5777, support at $0.5000, and a break-out point at $0.6799. Edrag Crypto’s prognosis has captured investors’ and enthusiasts’ attention alike, as they closely monitor these developments. At the time of writing, XRP was trading at $0.5284, indicating a 3% rise in the past week. While its market cap has reduced by about 1.28%, its trading volume has seen positive movement of more than 36% in the past day. Featured image from Shutterstock, chart from Tradingview.com

May 18, 2025 12:05

$40 Billion Worth Of XRP On The Move Where Are They Headed?

Onchain data shows that over $40 billion worth of XRP has been moved over the last week, which puts the altcoin on the edge. Specifically, these coins were transferred to exchanges, which indicates that XRP is at risk of a massive sell-off.  Over $40 Billion XRP Moved To Exchanges CryptoQuant data shows that over $40 billion has been moved to Binance this past week, with the exchanges reserves surging during this period. This development is usually bearish as it indicates that investors are looking to offload their coins. This comes as the XRP price surged to as high as $2.6, which explains this wave of profit-taking.  Related Reading: XRP Reaching Oversold Levels As Net Flows Turn Negative, Whats Next? Moreover, crypto analyst Ali Martinez revealed that Bitcoin whales have secured profits, selling over 30,000 BTC this week. As such, XRP whales may be simply mirroring this move. Meanwhile, Bitcoinist reported that XRP is reaching oversold levels as net flows turn negative, with the wave of sell-offs heightening.  This selling pressure comes amid Judge Analisa Torres ruling in the Ripple SEC lawsuit, which provides a setback for XRP. The judge denied the parties’ motion for an indicative ruling because the filing was procedurally improper. The ruling also sparked a massive sell-off, with XRP dropping over 4%. XRP risks losing its bullish setup as Martinez revealed that the key support zone is at $2.38, meaning that a drop below this level could lead to a deeper correction. However, a hold above this level could set the altcoin for a rally to new highs as the analyst revealed that there are no major resistance clusters ahead. Crypto analyst CasiTrades had warned that XRPs failure to hold above the $2.69 resistance could send its price towards $2.30 for a reset.  Altcoin Has Formed A Double Bottom Formation In an X post, crypto analyst Egrag Crypto revealed that XRP has formed a double bottom following the dip to $2.3126. He stated that the altcoin is still bouncing off the red descending trend line, showing resilience. The analyst added that the altcoin is experiencing some micro noise within the range between the Fibonacci 0.888 levels at $2.30 and $2.62.  Related Reading: XRP Price Set To Continue Uptrend As Stochastic RSI Moves Out Of Oversold Zone His accompanying chart showed that the key is for the XRP price to hold above the trendline at $2.3. A bounce from this level could send the altcoin as high as $3.8, near its current all-time high (ATH) of $3.84. Based on its historical performance, Egrag Crypto still expects the altcoins price to rally to between $27 and $33 in this market cycle.  At the time of writing, the XRP price is trading at around $2.37, down almost 2% in the last 24 hours, according to data from CoinMarketCap. Featured image from Getty Images, chart from Tradingview.com

May 16, 2025 12:05

XRP Moves Into Key Range Against Bitcoin As 3 Major Targets Show Up

XRP has re-entered a pivotal trading range against Bitcoin (BTC), stirring up excitement as technical signals suggest a potential breakout. This move is reinforcing its bullish position, highlighting three major price targets that could confirm a larger macro rally.  XRP Sets Sights On Key Targets Against Bitcoin After months of consolidation, the XRP/BTC trading pair is now back inside a critical triangle formation, which market expert Egrag Crypto has identified as a key price range to watch for potential breakout or breakdown moves. The analyst shared a short-term XRP/BTC chart on X (formerly Twitter), explaining how important this price range is for the trading pair to hit new bullish targets and reach even larger goals.  Related Reading: XRP Analyst Highlights Ultimate Targets And Selling Strategy As XRP Price Rebounds This triangle structure, dating back years, acts as a roadmap for XRP/BTCs potential breakout, but only if it successfully flips certain levels into support. The first major target highlighted by Egrag Crypto is $0.000003033, which represents the upper boundary of the triangle. A decisive breakout above this level would signal a structural shift, confirming a possible bullish breakout from the narrowing wedge.  The analyst’s second key target is $0.00003430, the local high from XRP/BTC’s last rally. This price level is crucial for momentum validation, as flipping this into support with strong volume would build strong confidence in the next upward move and show confirmation that it can hold above it. The third and most critical target the XRP/BTC pair is expected to reach is $0.00004300, which aligns with the Fibonacci 1.0 level and XRP/BTCs previous cycle high. A move beyond this level suggests the beginning of a macro rally, unlocking access to higher Fibonacci extension levels, including:  1.272 Fib ($0.00007244) 1.414 Fib ($0.00009546) 1.618 Fib ($0.00014191) 1.888 Fib ($0.00030000) The Altcoin Must Hold Support Or Risk Macro Breakdown While Egrag Cryptos breakout targets paint an optimistic picture, the XRP/BTC LTC analysis comes with a stark warning of a potential crash. The analyst has raised alarm bells, warning not to lose the 0.618 Fibonacci level at $0.00002032.  Related Reading: XRP Price To Break Out Of Consolidation: The Next Moonshot That Will Lead To $3 This support range acts as the last kind of defense for XRP/BTCs bullish market structure. The analyst goes as far as to say, Lose an arm, but dont lose this range, emphasizing the importance of maintaining this level. He further predicts that if the pair drops below this support level, it could see a decline to as low as $0.00000611. At the time of the analysis, XRP/BTC was trading at approximately $0.00002516, showing early signs of recovery after dipping below the triangle range. If bulls can defend this level and hold on to their upward momentum, the path toward flipping resistance levels into support becomes potentially clearer.  Egrag Crypto has also outlined potential price projections for the XRP based on the bullish scenario where the XRP/BTC pair reaches several upper Fibonacci levels and Bitcoin rallies to key milestones.  Featured image from Getty Images, chart from Tradingview.com

May 14, 2025 12:05

Two Major Fibonacci Levels Put XRP Price At $8.40 And $27

XRP’s price action in the past seven days has been nothing short of impressive. The cryptocurrency reached above $2.6 again in the past 24 hours, the first time doing so since early March, about two months ago. This movement has aligned with the uptrend projected by multiple analysts, who are referencing Fibonacci levels to chart XRPs future trajectory. Notably, a crypto analyst’s interesting outlook on social media platform X using Fibonacci levels suggests that XRP will reach $8.40 and $27 this cycle. Analyst Points To Fibonacci Targets At $8.40 and $27 XRP’s price structure in the current cycle has been significantly shaped by its breakout above a tightening wedge formation, which had compressed price action from 2021 through the early months of 2024. This formation, clearly visible on the monthly candlestick timeframe, served as a multi-year consolidation zone that capped upward momentum and defined a range-bound market.  Related Reading: XRP Price At $9 In September: Gann Angle Resistance Grid Predicts Surge The eventual breakout from this structure ended a prolonged bear market and began a fresh bullish phase. Although the past few months have been full of corrections and consolidations after XRP reached $3.31 in January, recent market momentum points to the next leg upward. A crypto analyst on social media platform X has pointed to two Fibonacci extension levels that could serve as the target zones during XRPs next impulsive wave up. According to the analysis, XRP reached both its 1.272 and 1.618 Fibonacci extension targets in the last cycle after breaking from a similar multi-year wedge accumulation structure in 2017. Interestingly, this move in 2017, leading up to the current price action, is part of the same Elliott wave count structure. As shown in the chart, XRP launched from a low of $0.00310 in 2017 to an all-time high of $3.40 in 2018 during its third wave (labeled (3)), hitting both Fibonacci extension levels of 1.272 and 1.618 before retracing in wave four.  According to the analyst, the current price action since 2020 constitutes the formation of the fifth impulse wave. Applying the same extension logic to the current structure from the 2020 low of $0.11379, a move to these Fibonacci extensions points to a target of $8.40 at 1.272 and $27.23 at the 1.618 extension. XRP To Reach $8.40 Or Even $27 This Market Cycle? Whether XRP can realistically surge to $8.40 or even $27 during this market cycle is yet to be seen. Although the 2017 to 2018 rally where XRP climbed over 1,000% in a matter of weeks offers a compelling case, market conditions today are more complex. The amount of inflows and trading volume needed to push the XRP price to such levels would be far greater than those witnessed before.  Related Reading: XRP Price Cross That Led To 20x Rally In 2017 Returns However, from a technical perspective, these Fibonacci targets can be reached when considering how similar price structures have behaved in the past. An example is the rally from $0.00310 to over $3.40 in 2017. One similar analysis from crypto analyst Ali Martinez suggests that the XRP price could reach $15 very soon. At the time of writing, XRP is trading at $2.50, up by 3.4% in the past 24 hours with an intraday high of $2.61. Featured image from Getty Images, chart from Tradingview.com

Apr 06, 2025 12:05

Cardano (ADA) At A Crossroads As Fibonacci Level Indicates Potential Fall To $0.42

Market prices of Cardano (ADA) increased by over 3% on Friday amid a general bullish wave in the crypto market. However, this minor uptick only follows the largely negative performance earlier seen in the week.  Notably, popular crypto analyst Ali Martinez postulates the ninth-largest cryptocurrency could still experience steeper market losses if certain technical support fails to hold. Related Reading: Shiba Inus Shibarium Marks 1 Billion Transactions Milestone, But Why Is SHIB Price Still Struggling? Cardano Critical Support Break Could Lead To 36% Decline In a recent post on X, Martinez shares a cautionary insight on the current ADA market structure hinting at a potential price fall. Based on the Fibonacci retracement levels, Martinezs analysis indicates that Cardano still trades near a vital support zone despite recent gains. The Fibonacci retracement levels are horizontal lines commonly used to identify potential support and resistance zones. They are based on the Fibonacci sequence and are widely used in anticipating a price fall, gain, consolidation, or reversal. Looking at the chart below, ADA currently trades at $0.66 which is just above the 50% Fibonacci retracement level at $0.63 – a price zone that has acted as a resilient support level in recent weeks. Ali Martinez warns a daily close below $0.63 would signal a bearish shift in market control at this level paving the way for a further decline.  In this case, Cardano could fall to test the next significant support at the 61.8% Fibonacci retracement level around $0.53. If the selling pressure prevails at this zone, ADA prices could potentially slide to $0.42 representing the 78.6% Fibonacci retracement level. Related Reading: Chainlink Whales Dump Over 170 Million LINK In Three Weeks Selling Pressure Ahead? What Next For ADA? Cardano has struggled to maintain a prolonged bullish form after reaching a local peak of $1.30 in early December 2024. Since then, ADA prices have been in a corrective phase alongside the broader crypto market.  For ADA bulls, defending the $0.63 price level is crucial to sustaining any valid bullish outlook. However, a successful price reclaim of the $0.78-$0.80 price zone would signal an impending price rally and market rebound for the altcoin.  At the time of writing, Cardano trades at $0.66 as earlier stated. Amid recent gains, ADA is down by 5.00% on its weekly chart and 33.58% on its monthly chart reflecting a domineering bearish influence in recent weeks. Meanwhile, daily trading volume has gained by 19.56% in the past 24 hours indicating a rise in market interest. This development suggests the recent price rally might be sustainable due to a strong conviction among buyers. Featured image from CoinCentral, chart from Tradingview

Apr 28, 2025 12:10

XRP Risks Falling To $1.25 Without Critical Price Break Analyst

Market analyst Egrag Crypto has tipped XRP to fall to $1.25 in the short term, barring a specific price development. Despite a bullish trading week, which saw the altcoin trade at $2.29, the market expert explains that XRP is yet to confirm a market bottom, indicating the potential of a future price fall. Related Reading: SUI Primed For Market Correction Analyst Sets Target At $2.75 Crucial Times Ahead: XRP Must Break $2.33$2.45 To Invalidate Bearish Forecast  In an X post on April 26, Egrag Crypto shared a bearish forecast on the XRP market, suggesting a potential downswing lies on the horizon. Based on the technical analysis of the XRP trading chart, altcoin appears to be trading below the Bull Market Support Band despite recent gains due to the extensive price correction in Q1 2025. For context, the Bull Market Support Band is a price zone formed from two moving averages to help traders detect whether an asset remains in a bull market or not. When prices fall below this support band, it often signals a bear market risk. For XRP to invalidate this negative forecast, the fourth-largest cryptocurrency must close above $2.33, which represents the immediate resistance level. Importantly, XRP must reclaim the $2.45, which currently acts as the upper edge of the Bull Market Support Band.  Achieving a decisive close above both critical price levels would signal a strong market demand and reduce fear of a larger price correction. However, if XRP fails to break above this band soon, the 0.702 Fibonacci level around $1.25 becomes a likely potential target.  Egrag Crypto explains that this Fibonacci level aligns with the previous breakout structure, thus making it a strong historical support. However, a price fall to $1.25 would only constitute a major retest, which could reinforce the long-term bullish structure of the XRP market. Related Reading: Ethereum Price Reaches Last H1 Support, Next Major Resistance Comes Into View XRP Price Overview At the time of writing, XRP trades at $2.18, reflecting a decline of 0.78% in the last day. The prominent altcoin is also down 5.08% on the monthly chart, indicating that bearish pressures are still strong in the market. According to data from Coincodex, market sentiment currently remains neutral, with investors still uncertain of XRPs future. Notably, only 40% of XRPs last 30 trading days have been profitable. Interestingly, Coincodex analysts expect the asset to retain its recent bullish form in the short term to potentially trade at $2.50 in five days. However, they remain highly bearish on long-term prospects, projecting a price of $1.97 in one month and $1.65 in three months. Featured image from iStock, chart from Tradingview

Mar 05, 2025 12:05

XRP Price Retraces Gains From Sunday Rally, This Important Support Level Could Be The Defining Factor

The XRP price has retraced and lost the gains it recorded from its Sunday rally following Trumps announcement that the crypto would be included in the crypto strategic reserve. Following this price correction, crypto analyst Trade City has key support levels that could determine XRPs future trajectory.  Important Support Levels For The XRP Price In a TradingView post, Trade City highlighted $3.06717 and $1.67220 as critical support levels for the XRP price on the weekly timeframe. While analyzing the weekly chart, the analyst noted that after bouncing along the ascending trendline, XRP confirmed its breakout above $0.73056, which sparked the main bullish leg, sending the crypto up to $3.06717.  Related Reading: XRP Bulls Shake Off Crash, Target This Major Resistance On The Road To $3.85 In line with this, Trade City remarked that $3.06717 is the all-time high (ATH) and a major supply zone. He added that the next bullish leg could begin soon enough if the XRP price can hold above this level. Meanwhile, in the event of a price correction, the analyst stated that the only key support viable in the weekly timeframe is $1.67220.  Trade City revealed that the Relative Strength Index (RSI) oscillator has exited the overbought zone and returned to normal levels. He asserted that the bullish scenario for the XRP price becomes more likely if the RSI re-enters overbought conditions.  Analysis Of The Daily Timeframe Trade City went further to give an in-depth analysis of the XRP price on the daily timeframe. He stated that the first key observation on the daily timeframe for the XRP price is a strong bearish divergence on the RSI, which formed as the price moved sideways inside the range between $2.02967 and $3.30467.  Related Reading: XRP Long Term Potential Remains Extremely Bullish Possibility Of Price At $20 The crypto analyst revealed that the trigger for this bearish divergence is a break below $2.02967, which has yet to happen. The analyst warned that a break below this support level could happen soon due to a drop in the trading volume. If this range breaks downward and the support level at $2.02967 is lost, Trade City stated that the XRP price could enter a deeper correction toward key Fibonacci levels such as 0.382, 0.5, and 0.618.  The analyst noted that these three Fibonacci levels are strong support zones, which could prevent a further sell-off. Meanwhile, on the bullish side, if the XRP price breaks to the upside from its current range, the analyst assured that a new bullish leg will begin, pushing the crypto toward higher targets. The analysts accompanying chart showed that the XRP price could rally to as high as $4, marking a new ATH for the crypto.  At the time of writing, the XRP price is trading at around $2.32, down over 12% in the last 24 hours, according to data from CoinMarketCap. Featured image from Adobe Stock, chart from Tradingview.com

Mar 19, 2025 12:10

XRP Price Breakdown below $2: Analyst Reveals Next Major Support

Crypto analyst MadWhale has raised the possibility of the XRP price experiencing a breakdown below the crucial $2 support level. The analyst also revealed the next major support if XRP drops below this support level.  XRP Price Could Drop To $1.90 If It Loses $2 Support In a TradingView post, MadWhale predicted that the XRP price could drop to the major support at $1.90 if it loses the psychological $2 level. He noted that XRP has demonstrated a classic triple-top formation, with each successive peak showing weaker momentum. In line with this, the analyst asserted that a break below the 42 threshold appears imminent as XRP nears a formidable resistance zone.  Related Reading: XRP Price Retraces Gains From Sunday Rally, This Important Support Level Could Be The Defining Factor MadWhale further stated that the downward move is expected to extend to at least $1.9, representing an 18% decline. The analyst added that such a price decline aligns with the primary target and a key daily support level. Crypto analyst Ali Martinez had also suggested that XRP could drop to as low as $1.2 if it loses the $2 support.  The analyst revealed that the XRP price was forming a head-and-shoulders pattern on the weekly chart, which puts the $2 support level in the spotlight. His accompanying chart showed that the crypto could drop to $1.2 if it breaks below $2. However, despite this bearish outlook, other crypto analysts, such as Egrag Crypto, have highlighted some positive aspects of the XRP price.  Egrag Crypto stated that the XRP prices dominance was showing tremendous strength and predicted that if it successfully closed above Fib 0.5, it could soon rally to the Fib 0.888 level. Crypto analyst Dark Defender predicted that XRP could rally to a new all-time high (ATH) if it continues to hold the crucial support levels at $2.04 and $2.22. The Altcoin Still In Waiting Mode Crypto analyst CasiTrades stated that the XRP price is holding strong but is still in waiting mode. She added that the bullish structure remains intact, with the altcoin holding above $2.26, which is the key .382 retracement support. The analyst noted that XRPs price has spent some time flipping the consolidation to support, indicating that markets are setting up for the next move. Related Reading: Analyst Shares Upper And Lower Targets For XRP Price The crypto analyst revealed the $2.70 and $3.05 resistance levels and $2.25 support level as the key levels to watch. She remarked that the XRP price needs to flip $2.70 and $3.05 to become support for the confirmation of the next wave up. Meanwhile, CasiTrades suggested that XRP risks dropping to as low as $1.54 if it loses the lower support support at $1.90.  The crypto analyst also mentioned that the price needs to break above $3.40, its current ATH, to confirm a new trend. Until then, the wait for signs of confirmation continues, which she claimed may not be obvious until wave 3 in the market cycle. CasiTrades asserted that key Fib levels have been breached, and the market is on the edge of a breakout.  At the time of writing, the XRP price is trading at around $2.29, down over 2% in the last 24 hours, according to data from CoinMarketCap. Featured image from Medium, chart from Tradingview.com

Nov 18, 2024 12:05

XRP Climbs Above $1, Fibonacci Levels Reveal More Gains Ahead

The price of XRP has moved above $1, entering a price zone last seen in 2021. Amidst the general crypto surge, the prominent altcoin is undergoing a remarkable price rally resulting in 104.59% surge over the last seven days. As it stands, XRP appears to be shooting for the stars with analysts now strongly bullish on how high the token can go. Related Reading: XRP Price Will Escalate To $1.03 This Week If This Happens: Analyst XRP ‘Kaboom’ Confirmed – Heres Price Path To $32 In an X post on November 16, market analyst EGRAG CRYPTO shared a positive prediction on XRP in regard to market cap following recent gains. EGRAG Crypto noted that XRPs market cap is closing above the Fibonacci level of 0.702 which corresponds to $51.35 billion, and has recently reached the Fibonacci level of 0.786, which represents $60.06 billion. Importantly, the coin is also breaking past an ascending trendline that stretches back to 2017, which all presents a super bullish signal that will initiate a series of significant price explosions. According to the analyst, if the XRP monthly candle closes above the Fibonacci level of 0.786, it will confirm an ascent to the Fibonacci level of 1.618 at which the crypto will attain total market shares of $283.42 billion. In regards to price action, the current supply of 57 billion XRP indicates a potential price target of $4.96 if this market cap is achieved. However, as earlier stated, XRPs recent price rally has ignited a strong bullish signal that is to result in a cascade of price surges. Therefore, EGRAG Crypto has projected multiple Fibonacci level targets for XRP market cap, with the attainment of each one, a confirmation of the next. Following a successful climb to the Fibonacci level of 1.618, future targets by EGRAG are levels 2.0, 2.272, and 2.618, at which XRP is expected to have market cap values of $577.86 billion, $959.66 billion, and $1.83 trillion. These market shares will correspond to prices of $10.13, $16.83, and $32.11, respectively. Related Reading: Bitcoin NVT Golden Cross Signals Local Bottom Whats Next? XRP Market Cap Hits $65 Billion, Becomes 6th Largest Crypto According to data from CoinMarketCap, XRPs market cap is now valued at $65.24 billion, reflecting a 26.51% gain in the past day. Notably, the altcoin has also flipped DOGE to become the sixth-largest cryptocurrency amidst the recent price gain. XRP began gaining aggressively on November 15, price increase after SEC Chair Gary Gensler hinted at a possible resignation which may spell some good news in the Commissions ongoing case with Ripple. These gains have been further strengthened by a massive buying spree by the XRP whales who are eyeing larger future gains. At the time of writing, XRP trades at $1.10. Meanwhile, the assets daily trading volume has increased by 104.46% and is valued at $23.13 billion. Featured image from CryptoRank, chart from Tradingview

Jan 31, 2025 12:05

Ethereum Price Forms Falling Wedge Pattern On 1-Day Chart That Suggests 20% Rally Is Coming

Ethereums price action is showing signs of an impending breakout as it moves back and forth within a falling wedge pattern on the daily candlestick time frame chart. According to an analysis first posted on the TradingView platform, this formation is a strong bullish signal that could push the Ethereum price toward $3,800 if history repeats itself.  The falling wedge, which is generally known to be a bullish price action structure, is developing between the 50-day and 200-day moving averages for Ethereum, in line with a similar pattern from that preceded an Ethereum price rally last year. Ethereum Repeating Falling Wedge Pattern Ethereum has largely underperformed this cycle without any clear breakout yet. Furthermore, the cryptocurrency has yet to recover towards its 2021 all-time high unlike many of its other crypto counterparts with large market caps.  Related Reading: Ethereum Price Eyes $4,000 With Rising Channel Pattern Technical analysis of the current Ethereum price action shows that the leading altcoin has been trading in a decline since the beginning of the year. This decline has been characterized by the formation of lower highs and lower lows, which is quite like a falling wedge pattern. Whats very interesting is that this wedge pattern on the Ethereum price chart is developing between the 50-day and 200-day moving averages, which makes it even more peculiar. The TradingView analyst highlighted that the current falling wedge price structure mirrors the March 2024 pattern, which saw Ethereum forming a triple bottom before breaking out and reaching the 0.786 Fibonacci extension level. If the same scenario unfolds, the current falling wedge could serve as a launchpad for a price surge towards a target at the $3,800 level. This represents a potential 20% upside from Ethereums current trading range. Resistance Levels Could Delay the Rally At the time of writing, Ethereum is trading at $3,180, up 1% in the past 24 hours. This marks a steady climb from the lower end of the wedge pattern, bringing the cryptocurrency closer to breaking above the upper trendline around $3,250.  Related Reading: Historical Data Shows What To Expect From Ethereum Price In Q1 2025 Its Very Bullish While the technical setup leans bullish after the predicted breakout, it is important to note that Ethereum faces a significant resistance hurdle between $3,400 and $3,500. Sellers positioned at this resistance zone have acted as a strong barrier in recent months, and they have successfully stalled previous attempts by the bulls to push higher. If Ethereum fails to break through the upper end of this range, another temporary rejection could occur before any sustained move toward $3,800. If Ethereum successfully clears the $3,500 resistance, it could pave the way for a more extended bullish trend, with $3,800 as the next logical target. Notably, this $3,800 target reflects a tempered outlook on Ethereum compared to past market expectations, a sentiment shaped by its recent price action. However, if strong bullish momentum builds toward $3,800, it could trigger an even larger push toward the $4,000 mark. Featured image from Unsplash, chart from Tradingview.com

Your Crypto Gateway

Claim 1,000
Free WCG Coins

World Crypto Global opens the door to digital freedom for everyone.
Manage your free WCG Coins securely—where simplicity meets global accessibility.

11 bn

FREE CRYPTO COINS

8.9 bn

AVAILABLE FOR RESERVATION

2.1 bn+

ALREADY ALLOCATED

× WCG Coin

🎉 Get 1,000 WCG Coins

No fees. No catch. Your crypto journey starts here.