Mt. Goxs suspected $2.1B BTC Bitgo wallet activates
A test transaction from a dormant Mt. Gox wallet triggers speculation around Bitgos role in the ongoing Bitcoin distribution to creditors.
Loading
Welcome at World Crypto Global. This portal is packed with useful content and resources to built out your own crypto skills. WorldCrypto is a site member of Gabriel Vega Network.

A test transaction from a dormant Mt. Gox wallet triggers speculation around Bitgos role in the ongoing Bitcoin distribution to creditors.
Mt. Gox begins Bitcoin distribution to creditors after a decade, marking a significant event in crypto history. (Read More)
Drawing lessons from past incidents such as the Mt. Gox and Bitfinex hacks, WazirX aims to apply the best practices from these cases to ensure a fair and efficient resolution.
After a decade of waiting, Mt. Gox customers will find their crypto assets worth much more than when the exchange collapsed.
Bitcoin whales continue accumulating, despite the potential sell pressure from Mt. Gox creditors, which could see 99% of investors selling.
Curve Finance shifts from 3crv to crvUSD for fee distribution, enhancing the stablecoins utility and ecosystem integration.
ZK Nation said its Sybil filtering approach was to ensure as many users as possible would get an allocation, but that would inevitably let through some Sybils.
Reasons for BTC's weakness include Mt. Gox coin movements, regulatory actions, and the U.S. Senate's anti-crypto lobby.
Stablecoins are a foundational part of the crypto market. Tracking their distribution across blockchains is essential for understanding the underlying trends in DeFi, as they represent the market’s liquidity. The total value locked (TVL) across all DeFi protocols currently stands at $107.427 billion. This TVL represents the dollar value of all the assets locked in […]
The post Ethereum’s grip on DeFi challenged by Tron’s stablecoin surge appeared first on CryptoSlate.
Market sentiment around the XRP price is flipping bullish as technical indicators and recent chart movements suggest a promising upward trajectory over the next three months. With momentum building, a crypto analyst is now eyeing a potential rally that could push XRP as high as $36. According to a new prediction posted by crypto analyst Dark Defender on X (formerly Twitter), the XRP price is gearing up for a potentially explosive surge to $36. XRP Price Forecasted To Reach $36 The chart analysis shows that XRP has broken through a crucial three-month resistance trendline that has capped its price action since its 2018 peak. This breakout signals a powerful shift in market structure, indicating that the long-standing bearish trend may be over. Related Reading: XRP Price Repeating History? 2017-Like Rally To Send Price To $10 Dark Defenders three-month candlestick chart applies the Elliott Wave Theory, mapping out a five-wave bullish structure. The analysis shows that Waves 1 and 2 have already played out, and XRP now appears to be entering Wave 3, which is typically seen as the strongest and longest wave. If this Wave 3 pattern holds, XRP could be on the verge of its most powerful rally yet. According to Dark Defender, the upside target could reach as high as $36.76, representing a staggering 423.6% increase. Before XRP reaches this projected price level, Dark Defender has forecasted shortto long-term bullish targets for the cryptocurrency. In the short term, XRP could reach $3.33, with a mid-term goal of $5.85. Additional milestones along the way include key percentage gain levels that may act as interim resistance zones. A 161.8% gain points to a potential price of around $13.81, while a 261.8% surge suggests a move toward $18.96. If momentum continues, the token could push further to $26.87, aligning with a 361.8% increase. On the downside, support levels at $2.3620 and $2.222 are expected to act as strongholds in case of any retracement before continuation. Moving forward, Dark Defender has doubled down on his bullish stance on XRPs future outlook, referencing a tweet dated March 17 that boldly declared, XRP is extremely bullish. Clear Path Ahead For The Altcoin As Resistance Thins Out In an X post released on May 13, Ali Martinez, a prominent crypto analyst, disclosed that on-chain data from Glassnode shows a clear bullish path for XRP, with no signs of major resistance clusters ahead. The analysis based on the UTXO Realized Price Distribution (URPD) indicates that a significant portion of XRP tokens were last moved at lower price levels. Related Reading: XRP Price Macro Channel Breakout That Puts Targets At $17-$55 The chart also highlights a significant support zone at $2.38, where nearly 1.85 billion XRP, amounting to 2.92% of its supply, were last transacted. This concentration of holders could serve as a psychological and technical support level if the market pulls back. Moreover, the absence of large token holdings at higher price ranges suggests that the price could experience a smoother ascent, unburdened by major resistance from profit-takers. Featured image from Getty Images, chart from Tradingview.com
EigenLayer, the second-largest DeFi protocol with $15.952 billion in total value locked, recently announced its native token's stakedrop. However, the distribution details have sparked disappointment and criticism within the crypto community. This article explores the allocation strategy, criticisms, and potential implications for EigenLayer. (Read More)
In a compelling forecast for Bitcoin, Ali Martinez, a well-known cryptocurrency expert and trader, has pointed out a possible development that could propel the crypto asset’s price to the $86,000 threshold in the foreseeable future. Bitcoin Movement Determined By Key Levels The analyst’s positive perspective highlights the possibility of a large upward shift in the price trend of Bitcoin, igniting interest and speculation in the cryptocurrency space. Ali Martinez’s analysis primarily focuses on several key support and resistance levels, of which a break out from these levels will determine the future trajectory of Bitcoin. Related Reading: Are The Odds In Bitcoin Bulls Favor? These Analysts Forecast BTCs Future According to the expert, it appears the digital asset has been gathering momentum in a parallel channel. As a result, the $61,000 mark becomes the most significant support level, while the $72,400 mark becomes the most crucial resistance level. Martinez affirms that Bitcoin might plummet toward the $56,200 and $51,600 range if it manages to surpass the aforementioned support level. However, should it break out from the $72,400 resistance zone, $79,000 and $86,000 are the next price targets to expect. Considering the UTXO Realized Price Distribution (URPD) chart, Martinez notes that $62,000 also proves to be an important support area for Bitcoin. If this level is lost, attention might move to the following significant demand region, which is situated around $51,500. On the other hand, the likelihood of the bull run rekindling would be largely increased should there be a rise back above $66,250. This suggests a new wave of confidence and enthusiasm from market investors and players. Martinez has also identified a notable shift in the accumulation trend score for Bitcoin lately. Specifically, the recent development marks the first time it has happened in six months, and it is now pegged at 0.27. This change suggests that BTC whales might be selling off their holdings rather than hoarding the crypto asset even more. Interest From ETF Investors To Impact Price Substantially Despite the negative performance of BTC lately, several analysts still believe the coin is headed for unprecedented heights. Crypto expert Willy Woo recently made a bold forecast, putting his price target at $650,000 at the bull market top and $91,000 at the bear market bottom. Related Reading: Bitcoin ETF Issuers Push Holdings To 4.27% Of BTC Supply Amid Crash To $61,000 Willy Woo expects the coin to top out at this level when ETF investors have completely deployed their capital based on asset manager recommendations. Furthermore, Woo stated that while these figures are quite cautious, Bitcoin will surpass the gold cap after ETFs have served their purpose. “Gold went on a 12-year bull run when its ETF was approved, now it is Bitcoin’s turn,” he added. In the last day, the price of Bitcoin has fluctuated between a low of $62,000 and a high of $66,000, ultimately concluding around $63,000. Its daily trading volume has decreased by 20%, indicating a declining intreest from traders. Featured image from iStock, chart from Tradingview.com
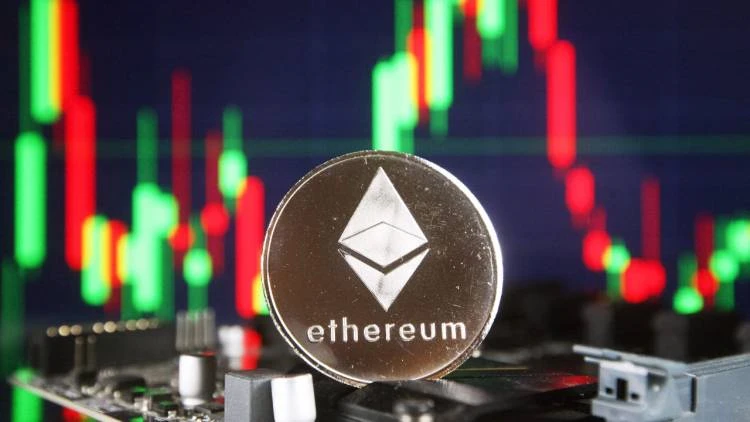
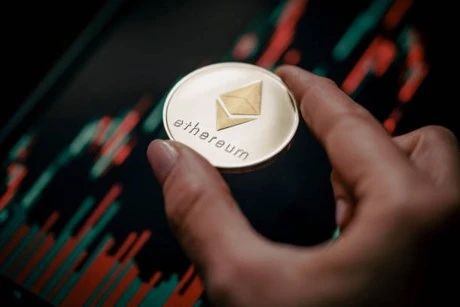
Ethereum (ETH) prices have surged by over 3% in the past day in line with a bullish upswing across the broader crypto market. However, Ethereum on-chain data reveals the altcoin has stumbled in a range-bound market hinting at a potentially prolonged sideways movement. Related Reading: Bitcoin Long-Term Holders Show Conviction: 63% Of Supply Hasnt Moved In A Year Ethereum Trapped In $1,548 – $1,599 Range – Glassnode In a recent post on X, prominent blockchain analytics firm Glassnode reports that Ethereum is trading in a tight range between $1,548 and $1,599. This development is revealed by the asset’s cost basis distribution (CBD), which shows the various price levels at which current ETH holders bought their coins. CBD is an important on-chain metric used to identify potential support or resistance levels based on the accumulation levels seen at price zones. According to Glassnode, a combined 1.53 million ETH, valued at $2.4 billion, was acquired between $1,548 and $1,599 indicating a high level of investor interest at these price regions. In particular, 793,900 ETH currently in circulation was purchased at $1,548, ultimately transforming this price floor into a major support zone for the current Ethereum price. Meanwhile, 732,400 ETH is held by investors at $1,599 representing a significant price barrier to any upward price movement. Interestingly, Ethereum has tested both price zones over the past day failing to produce either a price breakout or breakdown. Considering the accumulation level at both prices, the altcoin might maintain a range-bound movement barring the introduction of a market catalyst. Interestingly, such price behavior would align with the broader market uncertainty amidst unstable macroeconomic factors and tightening liquidity conditions. Related Reading: XRP Price Flashes Symmetrical Triangle From 2017, A Repeat Could Send It as Flying To $30 Important Ethereum Support Forms At $1,461 In other developments, Glassnode also notes that Ethereum bulls are building a critical support zone at $1,461 at which 380,000 ETH, valued at $595.8 million have been acquired. In the case of any breakdown from the current consolidation zone, this price level is expected to act as the next major support preventing any further downside. However, a daily price close below $1,461 could cause ETH to trade as low as $1,400 or $1,200. At the time of writing, Ethereum trades at $1,562 reflecting a 3.35% gain in the past 24 hours. However, the ETH market remains in a deep corrective phase with 14.56% and 18.45% losses in the last seven and thirty days, respectively. Meanwhile, the assets daily trading volume has declined by 34.06%, indicating a fall in market participation and a potential reversal of the recent rally, which would allow Ethereum to maintain a range-bound movement. Featured image from Bankrate, chart from Tradingview
The Aave platform is undergoing a major overhaul that will introduce new features to enhance user experience and safety. One of the key updates is a revenue redistribution mechanism, aiming to reward active participants and promote continuous growth within the ecosystem. Additionally, a new umbrella safety system will be implemented to further protect users’ funds [...]
The post Exciting Aave Revamp Proposal: Revenue Redistribution and Enhanced Safety System appeared first on Crypto Breaking News.
The distribution of XRP has reached new heights as the altcoin continues to trade below $3. According to recent data, there has been a significant surge in the dispersal of XRP tokens. This has led to a record level of distribution across various wallets and exchanges. Despite XRP’s price remaining below $3, the increased distribution [...]
The post Altcoin XRP Hits All-Time High Distribution Levels as Price Drops Below $3 appeared first on Crypto Breaking News.
Market prices of Chainlink (LINK) suffered another major decline in the past 24 hours as the general crypto market continued to react negatively to US new international tariffs. Over the last two months, LINK has exhibited a prolonged downtrend losing over 40% of its market value. Amidst this bearish market, popular analytics company Glassnode has highlighted two price cluster levels that have shaped investors’ behavior in this period. Related Reading: 640,000 Chainlink (LINK) Withdrawn From Exchanges In 24 Hours Bullish Accumulation? Chainlinks CBD Data Reveals Key Investor Clusters At $14.6 And $16 – What Could This Mean? In a recent post on X, Glassnode shared valuable on-chain insights on the LINK market using Cost Basis Distribution (CBD) – a metric that reveals at what prices investors acquired their assets, thus helping to determine potential resistance or support zones. According to Glassnode, LINKs data has identified two price levels with high accumulation activity i.e. $16 and $14.6, noting that both price zones feature long-term investors who have remained active since August-October 2024. In analyzing transactions at the $16 price level, Glassnode discovered that investors at this level have shown strategic repositioning by actively accumulating during downtrends. Source: @glassnode on XThis positive development has been observed during a price drop from $29 to $19 in December, a correction to around $18 in February, and most recently as prices reached a new low of $12.70 on March 11. Glassnode explains that these recurring transactions indicate the presence of high-conviction holders at $16.0 with strong long-term confidence in LINK and are thus less likely to sell their holdings. Conversely, LINK holders at $14.6 have shown a less active but more timely accumulation by investors at this price level. Glassnode shows that these investors increased their holdings during key phases such as when LINK traded at $17 and $28 in December, at $25 in January, and on March 15 following a major price gain from $12. These observations also suggest current LINK holders are not fast money allocators but patient and confident of a future price accumulation. Related Reading: Whale Grabs 506 Billion PEPEIs A Price Explosion Near? What Next For Chainlink? At press time, LINK trades at $14.0 just below the key cluster level at $14.6. The proximity to this accumulation zone indicates the market is at a critical juncture. However, Glassnode data suggests that holders at the $14.6 are not fast money traders and are likely to reinforce their position through another accumulation. If this positive scenario occurs, LINK could reclaim $14.6 and $16 which could serve as important support structures in a potential market rebound. Featured image from Token Metrics, chart from Tradingview
The on-chain analytics firm Glassnode has explained that Bitcoin tends to reach a potential top when the long-term holders show this pattern. Bitcoin Long-Term Holders Have Been Ramping Up Distribution In a new report, Glassnode discussed the influence that the BTC long-term holders have on the cryptocurrencys supply dynamics. The long-term holders (LTHs) here refer [...]
The post Bitcoin Long-Term Holders & Price Top: Glassnode Reveals Pattern appeared first on Crypto Breaking News.
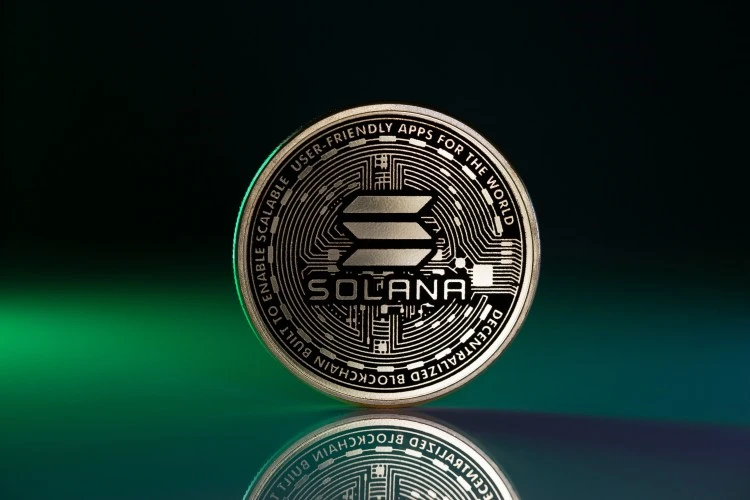
The analytics firm Glassnode has revealed the Solana price levels that could be important to watch, based on on-chain accumulation data. Solana Cost Basis Distribution Reveals Where Supply Is Most Concentrated In a new post on X, Glassnode has discussed about the UTXO Realized Price Distribution (URPD) of Solana. The URPD is an indicator that basically tells us about how much of the SOL supply was purchased at which price levels. Naturally, the metric uses the last transaction price of any token in circulation as its cost basis. Related Reading: Bitcoin Transfer Count Lowest Since 2023Is This Bearish? First, here is how the URPD looked when the cryptocurrency set its new all-time high (ATH) back in January: From the graph, it’s apparent that a few price levels like $144 stood out in terms of the amount of supply that they hosted. At the price levels closer to the new ATH, however, supply was quite thin, meaning not many coins changed hands there. In on-chain analysis, the potential of any level to act as support or resistance is measured in terms of the amount of supply that it hosts. This means that levels that have a large cluster around them on the URPD are the ones of importance to the asset. As for why this is so, the answer lies in investor psychology: holders are sensitive to retests of their cost basis. Whenever the price touches a large cost basis cluster, the investors who are holding these coins may respond by making some panic moves. These moves can tend toward buying if the retest is happening from above, as investors may want to defend their profit-loss boundary. In retests happening from below, however, the traders could react by selling instead, as they may seek to exit at their break-even. When SOL reached its ATH, there was a lack of support nearby. This may be why the asset ended up falling into the cluster that did carry a significant amount of supply. Below is a chart that shows how the URPD has changed following the price drawdown. From the graph, it’s visible that if SOL continues its downtrend, it may have to end up relying on the freshly grown $112 level. In January, this level hosted the cost basis of 4 million tokens, but today, the figure has grown to 9.7 million, equivalent to 1.67% of the entire supply. Beyond this level, Glassnode notes, “$94, $97, and $100 collectively hold nearly 21M SOL (3.5% of supply).” In the scenario that these support levels fail, Solana may find itself in trouble, as there aren’t any major supply clusters until $53. Related Reading: Dogecoin Shark & Whale Population RisesPrice Turnaround Incoming? In terms of the levels above, the $135 and $144 levels stand out, as they hold the acquisition level of 26.6 million and 27 million coins, respectively. These levels could act as major obstacles in SOL’s recovery. SOL Price Solana has jumped more than 5% over the last 24 hours to recover to the $130 level. Featured image from Shutterstock.com, Glassnode.com, chart from TradingView.com
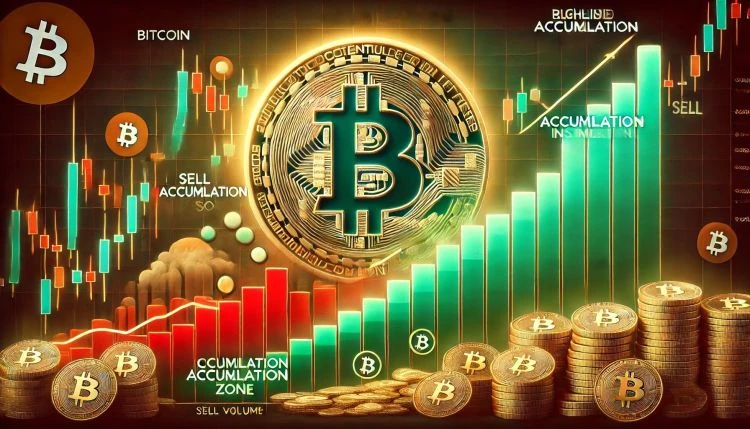
Bitcoin (BTC) continues to trade below the $85K level, fueling fears of further downside as the bearish trend remains intact. Bulls are losing momentum, failing to reclaim key resistance levels and hold lower demand zones, raising concerns about a potential continuation of the correction. Related Reading: 130,000 Ethereum Moved Off Exchanges Bullish Signal? Macroeconomic uncertainty and volatility remain key drivers of price action, with erratic policy decisions from U.S. President Donald Trump adding to the turbulence in both crypto and traditional markets. The global trade war narrative and tightening monetary conditions continue to weigh heavily on risk assets, contributing to Bitcoins inability to sustain a meaningful recovery. However, there is a shift in market behavior that could indicate a turning point. Key metrics from Glassnode reveal that after three months of distribution, Accumulation Trend Scores hint at early signs of BTC accumulation. Historically, a transition from distribution to accumulation has often preceded a recovery phase, suggesting that investors might be stepping back in at these lower levels. The next few weeks will be crucial, as Bitcoins ability to hold support and attract fresh demand will determine whether the market is preparing for a rebound or a deeper correction. Bitcoin In Correction Mode Accumulation Trends Hint At A Possible Shift Bitcoin has officially entered correction territory after losing the $100K mark, and the bearish trend was fully confirmed when BTC failed to hold above $90K. Since reaching its all-time high (ATH) of $109K in January, Bitcoin has dropped over 29%, and it appears this trend could continue as global macroeconomic conditions remain unfavorable. Related Reading: Solana Holds Bullish Pattern Expert Sets $140 Target Trade war tensions between the United States and key global economies like Europe, China, and Canada continue to pressure financial markets, leading to uncertainty and risk-off sentiment. As these geopolitical issues intensify, both crypto and traditional markets remain highly volatile, struggling to find stability. However, not all indicators are bearish. Ali Martinez shared insights on X, revealing that the tide is turning for Bitcoin. After three months of distribution, the Accumulation Trend Scores model is hinting at early signs of BTC accumulation. Historically, these phases signal that large investors are re-entering the market, positioning themselves ahead of a potential recovery. This accumulation phase is a critical turning point that will determine whether Bitcoin sees a fast recovery above key supply levels or a long consolidation period before the next major move. The next few weeks will be decisive for BTCs short-term outlook. $80K Retest on the Horizon? Bitcoin is currently trading at $83,000, caught in a tight consolidation as it struggles to break above $85K while maintaining support at $82K. This range-bound price action has left investors uncertain, with bulls attempting to reclaim higher levels and bears pressing for further downside. If bulls want to regain control, BTC must push above $89K, a key resistance level aligned with the 4-hour 200 moving average (MA). A successful breakout above $90K could confirm a recovery trend and open the door for further gains toward $95K and beyond. Related Reading: 640,000 Chainlink (LINK) Withdrawn From Exchanges In 24 Hours Bullish Accumulation? However, if Bitcoin fails to break above $90K in the coming sessions, the risk of a deeper correction increases. Losing $82K could send BTC into a downward spiral, potentially retesting $80K or even lower levels. With market sentiment still fragile, the next major move will likely determine the short-term trajectory of Bitcoins price action. Featured image from Dall-E, chart from TradingView
In line with major losses across the crypto market, Ethereum (ETH) declined by 17.08% in the past week reaching as low as $2,104. While the prominent altcoin has shown some minor gains in the past 12 hours, the general market sentiment remains bearish. Related Reading: Ethereum Retraces To Critical Monthly Demand Level Can ETH Hold Selling Pressure? ETH Correction Likely Headed To $1,890 – Here’s Why The ETH market is currently navigating a strong market correction with several analysts now spotlighting potential key support levels. According to prominent on-chain analytics firm Glassnode, data from the Cost Basis Distribution (CBD) metric indicates Ethereum is poised for a decline to $1,890 which represents its next major accumulation zone. For context, CBD is used to identify significant levels of an asset’s accumulation or distribution. These identified zones often act as support or resistance and are influential on price actions. Analysts at Glassnodes state that the major ETH accumulation zone below its current price is $1,890 at which investors acquired approximately 1.82 million ETH in August 2023. Interestingly, a two-year analysis of Ethereums CBD shows that some of these investors who accumulated ETH in August 2023 remain active. Notably, a significant number of them increased their cost basis during the crypto market in November 2024 while executing no distribution at range highs – a behavior that signals a strong confidence in long-term price appreciation. However, it is worth stating that $1,890 is not the immediate support zone for the ETH market. Glassnode states that CBD data also highlights $2,100 as the next support zone if Ethereum’s correction continues. This support level only holds around 500,000 ETH i.e. significantly lower than the accumulation seen at $1890. Albeit, investors can expect $2,100 to offer some short-term support before ETH experiences a deeper correction to $,1890. Related Reading: Is The Worst Yet To Come For XRP? Analyst Issues Dire Warning Is ETH Accumulation On Amid Price Dip? In a further analysis of the Ethereum market, Glassnode also reveals that a six-month perspective on the cost basis trend shows strong investor activity with at cost basis levels far higher than the current market price, particularly around $3,500. Notably, this cost basis has shown a gradual decline while increasing in concentration. This development indicates that rather than initiating a sell-off, investors are actively absorbing market supply as prices decline in anticipation of long-term gains. At the time of writing, Ethereum trades at $2,250 following a 3.84% gain in the past day. Meanwhile, its heavy decline over the past week moves its monthly losses to around 30.48%. However, its market activity has increased by 7.74% and is now valued at $29.91 billion. Featured image from iStock, chart from Tradingview
World Crypto Global opens the door to digital freedom for everyone.
Manage your free WCG Coins securely—where simplicity meets global accessibility.
FREE CRYPTO COINS
AVAILABLE FOR RESERVATION
ALREADY ALLOCATED

No fees. No catch. Your crypto journey starts here.