Bitcoin poised for volatility ahead of US interest rate decision Analysts
The Fed is expected to deliver its first interest rate cut since the pandemic, which could introduce more volatility before the next Bitcoin leg up.
Loading
Welcome at World Crypto Global. This portal is packed with useful content and resources to built out your own crypto skills. WorldCrypto is a site member of Gabriel Vega Network.

The Fed is expected to deliver its first interest rate cut since the pandemic, which could introduce more volatility before the next Bitcoin leg up.
According to 10x Research, Bitcoins potential drop below $50,000 is linked to dwindling buy flows and accelerating sell flows.
Bitcoin price whipsawed to $66,000 before recovering the top of its intraday range. Analysts explain why BTC is volatile today.
Only the holders with the least conviction will be selling Bitcoin on the Mt. Gox repayment news, according to popular on-chain analyst ZachXBT.
Data shows that the Bitcoin Realized Volatility metric has fallen to historically low levels. What generally happens after this pattern forms? Bitcoin Realized Volatility Has Decline To Extreme Lows Recently In a post on X, CryptoQuant author Axel Adler Jr has discussed about the latest trend taking place in the Realized Volatility of Bitcoin. The Realized Volatility here refers to an indicator that basically tells us about how volatile a given asset has been based on its price returns within a specified window. When the value of this metric is high, it means that the asset in question has experienced a large number of fluctuations during the period. On the other hand, the low indicator implies that the price action has been stale for the commodity. Related Reading: Ethereum Investors Take On Sky-High Leverage: Brace For Volatile Storm? Now, here is a chart that shows the trend in the 1-week Realized Volatility for Bitcoin over the last few years: As displayed in the above graph, the 1-week Bitcoin Realized Volatility has declined to pretty low levels of around 7% recently. This is so extreme that only ten other instances in the past six years have seen the metric go similarly low. This means that the cryptocurrency’s recent consolidation has been amongst the tightest in its history; as for what this trend in the indicator could mean for the cryptocurrency, perhaps past patterns could provide some hints. An inspection of the chart reveals that such stale price action in the asset has generally unwound with a burst of sharp volatility. The latest instance occurred right before the rally towards the new all-time high (ATH). Given this pattern, it’s possible that the recent BTC consolidation could also lead to another sharp move for the cryptocurrency. Something to note, however, is that the volatility emerging out of lows in the Realized Volatility has historically gone either way, implying that the price move emerging out of this tight range could very well be a crash. It remains to be seen how the Bitcoin price will develop from here on out, given the historically stale action it has witnessed over the past week. In other news, as Axel pointed out in another X post, the recent movement from the bankrupt exchange Mt. Gox has meant that many on-chain indicators have shown false signals. The analyst has cited the Bitcoin Adjusted Spent Output Profit Ratio (aSOPR) chart as an example. The aSOPR keeps track of the net profit or loss investors across the network realize. As the Mt. Gox BTC had been sitting still in wallets for quite a long time, it’s not surprising that its movement has “realized” a large amount of profit. Related Reading: This Bitcoin Metric Is One Of Cryptos Top Leading Indicators: Santiment Of course, this spike in the indicator isn’t actually a sign of profit-taking, so it’s not a signal that would impact the market. BTC Price Bitcoin has declined over the past day as its price is now down to $66,800. Featured image from Dall-E, CryptoQuant.com, chart from TradingView.com
Lower Bitcoin market volatility often precedes significant bull runs, suggesting that the current trend could propel prices toward the $100,000 to $150,000 range.
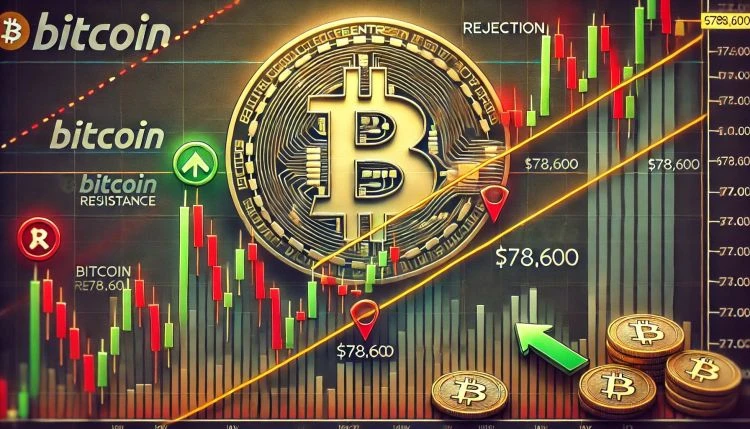
Bitcoin is facing a crucial test as it struggles to break above key resistance levels while holding just above critical support. The market remains stuck in a tight range, reflecting growing indecisiveness among traders and investors. Uncertainty has become the new normal, with macro conditions and political developments continuing to cloud sentiment. Related Reading: Whales Dump 760,000 Ethereum in Two Weeks Is More Selling Ahead? US President Donald Trump has added further volatility to the mix, unsettling financial markets with unpredictable policies and newly imposed tariffs. His erratic behavior has only intensified the fragile mood, pushing risk assets like Bitcoin into deeper consolidation. Despite brief rallies, Bitcoin has once again failed to break above descending resistance, according to crypto analyst Carl Runefelt. This rejection, paired with declining trading volume, is a sign that buyers may be losing strength. Runefelt warns that if volume continues to dry up and BTC remains stuck below key levels, the bearish target of $78,600 remains a strong possibility. While bulls are defending support zones for now, the lack of momentum is raising red flags. Unless Bitcoin can reclaim higher ground soon, the odds of a deeper correction will continue to grow making the coming days crucial for determining the markets next direction. Bitcoin Down 25% from January ATH As Bears Tighten Grip Bitcoin is now down 25% from its January all-time high, and bulls are struggling to regain control. After repeated attempts to reverse the trend, BTC continues to hold above the $81,000 level a key support zone but has failed to reclaim the $86,000 mark, which is necessary to confirm any serious recovery. The inability to push higher has weakened market confidence, and bulls now find themselves in a difficult position. Macroeconomic uncertainty and fears surrounding escalating trade wars, especially under U.S. President Donald Trumps unpredictable policies, have added to market volatility. These factors continue to favor the bears, and the pressure on high-risk assets like Bitcoin remains intense. With broader financial markets under stress, bullish sentiment in the crypto space is fading quickly. Panic is beginning to set in for some investors as selling pressure shows no sign of slowing. However, theres still a sliver of optimism among market watchers who believe that a bounce could follow once key resistance levels are reclaimed. Runefelt recently shared insights pointing to BTCs failure to break above descending resistance a bearish sign. He also noted that trading volume continues to decline, a sign that market participation is thinning out. This lack of volume often precedes large moves, and in this case, the bearish target of $78,600 remains firmly on the table if bulls fail to reclaim momentum. For now, the market remains on edge. Bitcoins ability to hold above $81K and attempt a move past $86K will be critical in determining whether a recovery is possible or if the next leg down is about to begin. Related Reading: Chainlink Consolidates In Triangle Pattern Is A 35% Breakout Imminent? Technical Details: Key Levels To Hold Bitcoin is currently trading at $83,500 after several days of choppy, volatile price action that has left traders uncertain about the markets next direction. The recent swings between key levels have highlighted the indecision among both bulls and bears, with neither side able to take full control. For bulls, the immediate challenge is to reclaim the $85,000 level, which aligns with the 4-hour 200-day moving average (MA). A successful move above this mark would be an encouraging signal of short-term strength. Beyond that, the next key level is $86,000, which is where the 4-hour exponential moving average (EMA) sits. Reclaiming this zone would help shift momentum back in favor of the bulls and potentially set the stage for a recovery attempt toward $90,000. Related Reading: Whales Offload 200M Cardano During March The Start Of A Trend? However, the most critical level in the short term is support at $81,000. This price zone has acted as a strong floor in recent weeks, and losing it would likely trigger further downside pressure. As macro uncertainty and market-wide volatility continue, bulls must defend this support while working to reclaim the MAs above. The coming sessions will be crucial in defining whether Bitcoin can recoveror slide deeper into correction territory. Featured image from Dall-E, chart from TradingView
Navigating New Frontiers: How the Bitcoin Volatility Premium AMC Is Redefining Investment Strategies
Bitcoin trades at $85.5K as market fear intensifies at 31 on the Fear & Greed Index. Analysts are keeping an eye on the $89.5K level
Data shows the cryptocurrency futures market has seen liquidations amounting to $700 million in the past day as Bitcoin has gone through its volatility. Bitcoin Has Seen Intense Price Action In Past 24 Hours The past day has been a bit of a rollercoaster for Bitcoin, with the asset registering sharp price action in both [...]
The post Bitcoin Volatility Induces $700 Million Carnage In Crypto Futures appeared first on Crypto Breaking News.
On-chain data shows the Bitcoin sell-side risk ratio has approached all-time lows recently, a sign that a big move could be coming for the coin. Bitcoin Sell-Side Risk Ratio Has Observed A Plunge Recently As pointed out by the lead on-chain analyst at Glassnode in a Tweet, BTC sellers may have become exhausted recently. The [...]
The post Bitcoin Sell-Side Risk Ratio Nears All-Time Lows, Big Move Soon? appeared first on Crypto Breaking News.
Bitcoin has observed a sharp rally above the $30,000 mark over the past day. Here’s how the 30-day price range may have foreshadowed this volatility. Bitcoin Had Earlier Compressed To A Tight 30-Day Price Range According to data from the on-chain analytics firm Glassnode, tight price ranges have historically preceded large moves in the cryptocurrency’s [...]
The post Bitcoin 30-Day Price Range Foreshadowed The Rally, Here’s How appeared first on Crypto Breaking News.
Data shows that Bitcoin volatility is currently at historically low levels, something that has led to violent price moves in the past. Bitcoin 7-Day Range Has Compressed To Just 3.4% Recently According to data from the on-chain analytics firm Glassnsode, the current 7-day price range is comparable to levels seen back in January of this [...]
The post Bitcoin Volatility Shrinks To Historical Levels, Violent Move Incoming? appeared first on Crypto Breaking News.
Data shows Bitcoin has been more stable than gold, DXY, Nasdaq, and S&P 500 recently, here’s what history says could follow next. Bitcoin 5-Day Volatility Has Fallen Below That Of Gold, DXY, Nasdaq, And S&P 500 According to the latest weekly report from Arcane Research, BTC has been more stable than these assets for a record duration already this year. The “volatility” is an indicator that measures the deviation of daily returns from the average for Bitcoin. When the value of this metric is high, it means the crypto has been registering a higher amount of returns compared to the mean, suggesting that the coin has involved a higher trading risk recently. On the other hand, low values imply there haven’t been any significant fluctuations in the price in recent days, showing that the market has been stale. Now, here is a chart that shows the trend in the 30-day volatility for Bitcoin over the course of its entire history: The value of the metric seems to have plunged in recent days | Source: Arcane Research's Ahead of the Curve - January 10 As shown in the above graph, the Bitcoin 30-day volatility is at very low levels currently as the price has been trading mostly sideways in recent weeks. The current values of the indicator are the lowest since 2020, but they are still higher than some of the lows during previous bear markets. Related Reading: Shiba Inu Bullish Signal: Whale Withdraws $34.7M In SHIB From Binance One consequence of this recent flat movement has been that BTC has become more stable than assets like gold, DXY, Nasdaq, and S&P 500. To compare these assets’ volatilities against each other, the report has made use of the 5-day volatility (and not the 30-day or 7-day one). The below table highlights the periods in BTC’s lifetime when the crypto’s 5-day volatility has been simultaneously lower than all these traditional assets. Looks like such occurrences have been a very rare event | Source: Arcane Research's Ahead of the Curve - January 10 As the table displays, there have only ever been a handful of instances where the Bitcoin 5-day volatility has been lower than that of gold, DXY, Nasdaq, and S&P 500 at the same time. The report labels such occurrences as “relative volatility compression” periods. It seems like, before the latest streak, the highest duration of this trend was just 2 consecutive days. This means that the current relative volatility compression period is already the longest ever in the coin’s history. Related Reading: Bitcoin Exchange Inflows Fall To 2020 Levels As Activity Remains Low Another interesting fact in the table is the total returns in Bitcoin that were observed in the 30-day period following the first date of the volatility compression in each of these instances. Besides one occurrence (September 29, 2022), all other volatility compression periods were succeeded by the price becoming highly volatile and registering large returns. It now remains to be seen whether a similar pattern will follow this time as well, with Bitcoin experiencing a wild next 30 days after this seriously flat price action. BTC Price At the time of writing, Bitcoin is trading around $17,400, up 3% in the last week. BTC has surged in the last few days | Source: BTCUSD on TradingView Featured image from Jievani Weerasinghe on Unsplash.com, charts from TradingView.com, Arcane Research
Bitcoin volatility has been on a decline since the start of December. This has been a culmination of both low interest from investors, as well as the declining prices of digital assets in the market. It has not led bitcoin to record its lowest volatility level on record yet. Bitcoin At All-Time Low Volatility Will Clemente shared a chart on Sunday that showed that bitcoin volatility had fallen to an all-time low. The chart itself is interesting in the fact that it shows just how the bitcoin volatility had been moving over the last few months. Related Reading: FTX Token Jumps 65% As SBF Returns Home, Can FTT Hold The Gains? There were multiple spikes in volatility from the start to the middle of the year 2022. However, toward the end, volatility dives off a cliff and continues this downtrend at this time. Keep in mind that the volatility of an asset is basically how much the price in dollars moved up and down in a given period. The larger the movement in price, the higher the volatility of a coin. Given that the price of bitcoin has been more or less steady over the last few months, it tracks that the volatility would be lower. Then in December, the price of bitcoin had mainly revolved around the $16,000 level, causing volatility to decline. Bitcoin has barely moved price-wise in the last 7 days, up only 0.56% in this one-week period. It is the lowest that volatility has ever been, and while it would normally paint a bullish picture for the digital asset, it has invigorated the bears. BTC stalls at $16,800 | Source: BTCUSD on TradingView.com Not A Good Time For BTC Now, more often than not, when volatility falls to such low levels, it has been right before a bull market where prices had recovered sharply. However, the timing of these have also mattered greatly because it is what determines whether low volatility is bearish or bullish. One of the times when low volatility had been very bearish was back in 2018. Like now, the market had just come out of an explosive bull rally that saw bitcoin hit new all-time highs. But with such low momentum, it had caused the price to crash a further 50%. Related Reading: Ethereum Stalls At $1,200, Why Bears Still Have The Upper Hand Given the similarities of both situations, it is likely that this will go as it did in 2018 compared to when volatility hit a low in 2020. The bitcoin bottom is likely not in too, which lends credence to this bearish case, although the decline may not be as high as 50%. This chart posted by Twitter user @DrahoslavP puts in perspective just how volatility has affected the price of the digital asset. Every time volatility fell below value "1" it was followed by bullish rally with one exception – october 2018. pic.twitter.com/pzW1GCAr40 — Data Patron (@DrahoslavP) December 25, 2022 Nevertheless, it is not all bad news for bitcoin. In fact, looking over the long term, it is important for this to happen. Right after the low volatility and eventual decline in 2018, bitcoin marked the bottom of the bear market. This had given way to the recovery that would set the pace for the next bull market. In other words, if a decline follows the current volatility trend, then it may present the best opportunity for investors to get into the digital asset. For BTC bottom chasers, this could be the holy grail of bottom indicators. Featured image from CoinDesk, chart from TradingView.com
The FOMC meeting is currently looming above the financial markets, including bitcoin, given that it is just a few days away. Previous interest rate hike trends and the fact that inflation remains a prominent threat have led to a negative outlook for the FOMC meeting. It is expected that another Fed interest rate hike is on the horizon, which will no doubt have a profound effect on the crypto market. FOMC Meeting Draws Near The next FOMC meeting will take place on November 1-2 according to the official schedule. It happens around once every one to two months and is important as this is where the Fed decides what to do in regard to the economy and keeping it healthy. Related Reading: Ethereum Devs Try To Leverage Price Surge As Smart Contracts Reach New High Unlike the previous years, 2022 has been a very hard year, not just for the United States economy, but for economies all around the world. Inflation rates have been reaching levels not seen in decades and the Fed has had to tighten up its policy in response to this. Interest rate hikes have been the norm for the last couple of months, in most cases, coming in higher in most cases than expected. This time around, Wu Blockchain has said that the expected interest rate hike is 75 BPS, with an 81% probability of this happening. If it does play out this way, then this would be the fourth consecutive interest rate hike of 75 bps by the Fed, which could have negative consequences for assets in the crypto space such as Bitcoin. On November 2 next week, the United States will announce the Fed Interest Rate Decision, and the probability of raising interest rates by 75bps is currently 81%. The U.S. unemployment rate for October will be released on November 4. https://t.co/nGgrVQN0to — Wu Blockchain (@WuBlockchain) October 31, 2022 How Will Bitcoin Respond? The past performances of bitcoin in relation to interest rate hikes by the Fed can often be a guide for what to expect in the future. If the current prediction for another 75 bps turns out to be right, then it will be an extremely volatile week for bitcoin and the crypto market. BTC continues to trend upward | Source: BTCUSD on TradingView.com Back in September when the Fed had last increased interest rates, the price of bitcoin had responded quite negatively. In fact, it would prove to be the most volatile reaction to the FOMC meeting given that BTC’s price had dropped more than 5% in one minute. This was going off a three consecutive interest rate hike. Related Reading: Can Elon Musk Influence The Next US Election? Another interest rate hike this week is expected to lead to even larger volatility in the market. This will also coincide with the profit-taking that is currently ongoing due to bitcoin’s recovery above $20,000. It could be the last straw that drags the digital asset back below $20,000 once more. However, the interest rate hikes are not expected to continue indefinitely. It is likely that 2023 is going to see a reversal in this trend, which would present a growth opportunity for risk assets such as biotin. Featured image from Coinews, chart from TradingView.com Follow Best Owie on Twitter for market insights, updates, and the occasional funny tweet…
On-chain data shows both the Bitcoin taker buy and taker sell volumes registered large spikes over the past day as the price goes through volatility. Bitcoin Taker Buy And Taker Sell Volumes Have Surged Up To High Values As pointed out by an analyst in a CryptoQuant post, both the BTC taker buy and taker sell volumes hit more than $1.8 billion yesterday. The “taker buy/sell volume” is an indicator that measures the Bitcoin long and short volumes on derivatives exchanges. The metric distinguishes between these two volumes based on whether the transaction occurs at the ask price (taker buy) or the bid price (taker sell). When these volumes are high, it means the exchanges are receiving a large amount of orders right now. This kind of trend usually leads to higher volatility in the price of the crypto. Related Reading: Bitcoin MVRV Ratio Is Back Below 1 As Average Holder Slips Into Loss On the other hand, low values suggest there is little activity in the market at the moment, which can result in a more stale price action for BTC. Now, here is a chart that shows the trend in the Bitcoin taker buy and taker sell volumes during the last couple of weeks: The values of the two metrics seem to have shown large spikes during the past day | Source: CryptoQuant As you can see in the above graph, the Bitcoin taker buy and taker seller volumes have seen quite sharp increases recently. These spikes have come just after the Federal Reserve chairman Jerome Powell delivered an interest rate warning in a speech yesterday. Related Reading: What The Negative Bitcoin Funding Rates Say About Investor Outlook The taker buy volume took just an hour to reach $1.8 billion, while the taker sell volume rose even higher at around $1.92 billion. The value of Bitcoin observed a drop below the $20k level some time after this elevation in the market activity. Currently, it’s unclear whether this was it for the volatility or if the coin will continue to see more sharp price action in the near future. BTC Price At the time of writing, Bitcoin’s price floats around $19.8k, down 6% in the last seven days. Over the past month, the crypto has lost 6% in value. The below chart shows the trend in the price of the coin over the last five days. Looks like the value of the crypto has sharply declined over the last twenty-four hours | Source: BTCUSD on TradingView After moving mostly sideways during the past week, Bitcoin seems to have broken out of the range today as the crypto has dipped below the $20k mark for the first time since the middle of July. Featured image from Kanchanara on Unsplash.com, charts from TradingView.com, CryptoQuant.com
Let Fidelity take the wheel and drive you through the wonderful world of volatility. Bitcoin critics wield one of the asset’s main characteristics as an unsolvable failure, but, is it? According to Fidelity, “bitcoin is fundamentally volatile.” That doesn’t deter it from fulfilling “its ultimate investment objective of preserving wealth over long time periods.” Related Reading | Fidelity Says What We’ve Been Thinking: Countries & Central Banks Will Buy BTC The company said all that in Fidelity ‘s latest edition of “The Research Round-Up.” In their longer explanation, they use oil and gold as examples to explain the whole volatility process. We’re in the summarizing business, though. Here at NewsBTC, we will distill their article, state the main points, and briefly comment on them. Fidelity Explains Bitcoin’s Fixed Supply “Bitcoin is unique in that it is a good whose supply is completely inelastic to changes in price. In other words, supply does not (and cannot) change in response to price.” There will only ever be 21 million bitcoin and that’s that. With other goods, there’s a cycle. “Going back to economic principles, we know that when demand increases for a good, in the short-term the price will rise. However, the higher price then incentivizes suppliers to produce more. More supply will then bring down the price.” This doesn’t happen in bitcoin. “With bitcoin, supply cannot change regardless of what price does. Therefore, any change in demand, short-term as well as long-term, will have to be reflected by changes in price.” It’s only logical. The laws of supply and demand can only affect the price, and so they do. “There is no change in supply to dampen the effect of price moves, even over the longer-term.” Mix that with an ever-decreasing supply of new coins, due to the halvings, and you have a perfect recipe for what bitcoiners call “number go up technology.” Fidelity summarizes the phenomenon with a quote from Parker Lewis: “Bitcoin is valuable because it has a fixed supply and it is also volatile for the same reason.” Those two characteristics come in a package. BTC price chart for 03/09/2022 on FX | Source: BTC/USD on TradingView.com Bitcoin As A Store Of Value “Something that has low volatility is not necessarily a good store of value in the long run, while something that has high volatility does not mean that it can’t be a good store of value in the long run.” It’s easy to get scared by volatility. Investors, traders, and even true believers let their feeling get in the way and exit the market with every little bump in the road. However, there’s no one that has holded bitcoin for more than four years and is in the red. Literally no one. Related Reading | Bitcoin Volatility Drops To 15 Month Low; What This Could Mean Let’s get an obvious example from Fidelity, “The U.S. dollar is not volatile but has also not been a good store of value in terms of purchasing power, while bitcoin is considered very volatile, but has been a much better store of value over the past ten and even five years.” “Volatility is a byproduct of price discovery, and there is no other way for price discovery to happen in a free market.” Even though bitcoin is 13 years old, it’s still going through price discovery. How much is bitcoin really worth? We won’t know for years, even decades. “This process of individuals all coming to adopt bitcoin in different ways and timeframes necessarily must produce volatility,” completes Fidelity. Fidelity Thinks Bitcoin’s Volatility Is Decreasing “The limited historical evidence we do have so far appears to be showing volatility declining over the long-term.” Bitcoin Volatility decreasing | Source: Fidelity The graph clearly shows that volatility is slowly fading. This is only logical. Fidelity explains, “as gold went through a major price discovery process in the 70’s, which then resulted in amassing a larger base of investors, volatility naturally declined.” We’re still early, though. This is not financial advice, but, for now, you should learn how to ride volatility and use it in your favor. Featured Image by Chris de Tempe on Unsplash | Charts by TradingView and Fidelity
Data shows that the indicators related to the Bitcoin derivatives market have recently been heating up, which could lead to more volatility in BTC’s price. Bitcoin Open Interest & Leverage Ratio Have Shot Up As pointed out by CryptoQuant community analyst Maartunn in a new post on X, the Bitcoin Open Interest has registered a [...]
The post Bitcoin Derivatives Market Heating Up Again: Brace For Impact? appeared first on Crypto Breaking News.
Data shows Bitcoin has been stuck in a historically tight 14-day range recently, something that has decompressed into big moves in the past. Bitcoin 14-Day Range Has Been Extremely Narrow Recently According to data from the analytics firm Glassnode, the 14-day range has only been narrower than now during less than 2% of the cryptocurrency’s [...]
The post Bitcoin Stuck In Tight Range: Will BTC Decompress With A Big Move? appeared first on Crypto Breaking News.
World Crypto Global opens the door to digital freedom for everyone.
Manage your free WCG Coins securely—where simplicity meets global accessibility.
FREE CRYPTO COINS
AVAILABLE FOR RESERVATION
ALREADY ALLOCATED

No fees. No catch. Your crypto journey starts here.