W o r l d . C r y p t o . G l o b a l

Loading

Welcome at World Crypto Global. This portal is packed with useful content and resources to built out your own crypto skills. WorldCrypto is a site member of Gabriel Vega Network.

Contact Info

CATEGORY: band


Litecoin Inches Toward Bollinger Band Buy Signal After 6% Surge

Author: Tony "The Bull" Severino
United Kingdom
Jul 30, 2024 12:05

Litecoin Inches Toward Bollinger Band Buy Signal After 6% Surge

Litecoin is among the crypto market leaders today, surging 6% intraday while Bitcoin remains flat. The single-day rally in LTCUSD might be enough, however, to generate a near-term buy signal using the Bollinger Bands. What might this mean for the altcoin, and could this be a sign that a more positive trend is beginning? Possible Buy Signal Setup Lights Up In Litecoin Litecoin has been among the most painful coins to hold over the last several years. In 2017, the silver to Bitcoin as digital gold went on a monumental, nine-month rally. During that nine-month stretch, Litecoin gained over 10,000% and put the coin in the top ten cryptocurrencies by market cap. Related Reading: Litecoin Is A Hub Of Whales: Over $2.85 Billion Of $100,000 Transactions Processed A lot has changed since then, with Litecoin now ranked number 18 by market cap, barely holding onto top 20 status. The altcoin has mostly trended sideways for the past seven years since the 2017 bull run, much to the disappointment of investors. Brighter days might be ahead, at least in the near-term, as LTCUSD is working on a buy signal according to the Bollinger Bands.   All About The Bollinger Bands And How To Use Them The Bollinger Bands aren’t just a technical indicator, but act as a complete trading system. The tool is primarily used to gauge volatility, as the bands tighten and narrow when volatility is low. When the bands begin to expand, it is a sign that volatility is returning. Beyond that, however, the Bollinger Bands can also generate a buy and sell signal depending on where price is relative to the upper and lower bands. Each band is set at a +2 standard deviation from the middle-line, which is a 20-period simple moving average. Related Reading: Litecoin (LTC) Set To Wake Up, According To Legendary Traders Forecast The idea is that only the strongest and most likely to be sustainable moves make it outside the upper or lower band. A 6% surge today in LTCUSD was enough to make it above the upper Bollinger Band. A close above the upper band is necessary to confirm the buy signal, especially when supported by higher than normal volume. A volume downtrend has been broken, checking this additional box in setting up the coin for a buy signal. Tony Severino, CMT is the author of the CoinChartist (VIP) newsletter. Sign up for free. Follow @TonyTheBullBTC & @coinchartist_io on Twitter. Or join the TonyTradesBTC Telegram for daily market insights and technical analysis education. Please note: Content is educational and should not be considered investment advice. Featured image from ChatGPT, Charts from TradingView.com

Jul 20, 2024 12:05

Bitcoin Bollinger Bands Squeezing: Is BTC Ready For $140,000?

Bitcoin is in an uptrend, but events in the daily chart show pockets of weakness. Though BTC is stagnant, analysts are upbeat, expecting prices to rise in the days to come. Is Bitcoin Ready To Rip Higher: Analyst Says Bulls Are Eyeing $140,000 Taking to X, one analyst has picked out an unusual development: In the weekly chart, the Bitcoin Bollinger Bands (BB) is currently at their tightest level in history. Besides April 2016 and July 2023 events, the Bitcoin BB is tightening, forming a squeeze. Related Reading: Solana Price Could Eclipse $1,400 As Massive Bull Flag Emerges Since BB is a technical indicator used to gauge underlying volatility, what’s happening now should draw traders’ attention. Specifically, prices tend to explode within the next few sessions whenever BB forms a squeeze, compressing to what is now. However, traders should also know that the direction of breakout can be in either direction. In the past, Bitcoin prices rose higher. To illustrate, after the BB squeeze in July, the coin went on to fly in the coming months, breaking $70,000 by March before the coin rose to $73,800. If the past guides, and indeed, prices explode at the end of this squeeze, the analyst predicts Bitcoin flying to $140,000 and even $190,000 in the next few months.   The expansion would be a welcomed boost for bulls, considering that prices are now in what the analyst described as a “boring zone.” Any uptick above $73,800 and all-time highs, pushing BTC to six-digit levels, would automatically be in the “banana zone.” Spot BTC ETF Issuers On A Buying Spree, Donald Trump’s Endorsement The confidence that Bitcoin will rip higher is also due to fundamental factors. Despite the current price lull after the refreshing surge earlier this week, spot Bitcoin ETF issuers are buying. BlackRock is spearheading this buying spree. Records show that the asset manager bought over $1 billion of BTC in July. On July 18, one observer noted that they bought 18,600 BTC, or $107 million worth of the coin, on behalf of their clients. According to SosoValue, as of July 19, BlackRock’s IBIT manages over $20 billion worth of BTC. Related Reading: Mass Exodus? Over 672,000 Bitcoin Holders Drop Out Amid Market Shifts Moreover, adding fuel to the fire, it is speculated that if Donald Trump wins the United States presidency, his administration might consider BTC a strategic reserve. While this possibility is debatable for now, it highlights the growing interest from policymakers, which is a massive boost for crypto. Feature image from DALLE, chart from TradingView

Jul 12, 2024 12:05

XRP Set To Skyrocket 60,000% On Tightest Bollinger Bands Ever: Analyst

In an analysis shared via X and YouTube, crypto analyst Matt “The Great Mattsby” Hughes highlighted what could be a historic move for the XRP price, based on the Bollinger Bands indicator. Hughes points to an impending squeeze in XRP’s monthly Bollinger Bands, suggesting a potential spike similar to previous rallies where the cryptocurrency saw massive gains. Hughes explained via X: “XRP has one of the tightest monthly Bollinger Band squeezes in its history and in all of crypto right now. The last time it squeezed like that, it shot up 60,000%.” In a YouTube video, the crypto analyst went into more detail, explaining how the XRP price has behaved in the past when the Bollinger Bands have been this tight. XRP Could Skyrocket To $250 The first instance, according to Hughes, occurred between September 2016 and March 2017. During this period, the XRP price consolidated for several months, causing the Bollinger Bands to tighten dramatically. After this period of consolidation, the XRP price skyrocketed, achieving gains that Hughes estimates to be around 60,000%. The second time was from December 2020 to April 2021. In this case, XRP rose by around 1,000%. “So it was much less than this period here and simply because it looks like it wasn’t as tight as it was right here [the first time], we can see it was much tighter during the first time, Hughes explained. Related Reading: Crypto Whales Buy The Dip As $22 Million In XRP Flows Out Of Binance This is the third time. Notably, “is the tightest it has ever been, even tighter than the first time, which suggests that it should explode much higher than previous cycles,” he said. The Bollinger Bands are a technical analysis tool defined by a set of trendlines two standard deviations (positive and negative) away from a simple moving average (SMA) of a security’s price, but can be adjusted to suit the user’s preferences. A narrowing of these bands typically indicates low volatility with the potential for a major bullish or bearish price movement once the bands begin to widen again. Hughes also examines the duration from the all-time high to the current price, noting that 2,373 days have elapsed. This long period of relative inactivity in price growth, combined with the extreme tightness of the Bollinger Bands, forms the basis of his prediction of an imminent significant move higher. It’s the tightest in its history as well so that just kind of proves to me that there is going to be a move sometime in the near future. I’m not sure when but sometime, we can see that this is looking more and more like it wants to break out, Hughes remarked. Related Reading: Crypto Analyst Predicts XRP Price Crash To $0.07 Amid Triangle Breakdown In addition to the technical perspective, he also discussed XRP’s price performance relative to its 20-month moving average. He notes that, similar to previous patterns, XRP has spent a considerable amount of time below this moving average prior to significant rallies. In both previous instances, XRP’s breakout was preceded by a period below this moving average, followed by a breakout that began after testing the bottom of the Bollinger Band. Notably, the price of XRP hasn’t yet tested the bottom of the Bollinger band. Therefore, Hughes speculates about a potential price drop as a “final flush out”, possibly down to the $0.30 area before a potential breakout. Such a move would be in line with previous cycles where a test of the lower Bollinger Band has led to strong rallies. So there is a possibility that the price could come down to test it. Maybe one last flush out maybe down into the $0.30s, we don’t know but if that’s the case then that’s just more confluence of the previous cycles that price can still just break out, he concluded. By the way, if history were to repeat itself and XRP were to increase by 62,000%, it would reach a price of $250. At press time, XRP traded at $0.44574. Featured image created with DALL·E, chart from TradingView.com

Jul 02, 2024 01:50

Band Protocol Price Prediction for Today, June 30 BAND Technical Analysis

The Band Protocol price prediction reveals that BAND is facing key resistance at $1.25 as the market price heads to the upside. Band Protocol Prediction [...]

Jun 04, 2024 12:05

Crypto Analyst Says Bitcoin Will Rise To $79,600 If This Holds

An analyst has explained how Bitcoin will “likely rise to test” the $79,600 level if BTC can hold above this important level of a pricing model. Next Bitcoin MVRV Pricing Band Is Currently Valued At $79,600 In a new post on X, analyst Ali Martinez has talked about where BTC’s next destination could be based on an on-chain pricing model. The model uses the popular “Market Value to Realized Value” (MVRV) indicator. This metric tells us how the value that the Bitcoin investors hold right now (that is, the market cap) compares against what they put in (the realized cap). Related Reading: Ethereum Investors Take On Sky-High Leverage: Brace For Volatile Storm? When the value of this indicator is greater than 1, it means that the holders as a whole are carrying a value higher than their initial investment; that is, they are in net profits. On the other hand, the MVRV being less than this threshold implies that the overall market is underwater at the moment. There are a couple of pricing models based on this metric, but in the context of the current discussion, the “MVRV extreme deviation pricing bands” are of interest. This model’s standard deviations around the MVRV mean signify the relevant price levels. Below is a chart that shows how these levels currently look for Bitcoin. As the graph shows, Bitcoin is currently trading above the +0.5 pricing band. At the price level corresponding to this 0.5 level ($66,800 right now), BTC’s MVRV value becomes 0.5 standard deviations above its mean value. According to this model, the next level of interest is the +1, where the MVRV is 1 standard deviation over its mean. The price level at which the MVRV ratio would satisfy this condition is $79,600. Historically, tops in the cryptocurrency have tended to form when the price breaches past this MVRV pricing band level. From the chart, it’s visible that BTC surpassed this level earlier in the year when it set its new all-time high, which continues to be the peak of the rally so far. Related Reading: Bitcoin Realized Volatility Showing Very Rare Trend: What Could Be Next Ali suggests that if Bitcoin can continue to hold above $66,800 (the +0.5 pricing band level), the asset will “likely rise to test the 1.0 pricing band at $79,600.” A potential rally to this level would imply an increase of more than 14% for BTC from its current price. Why do tops tend to be more probable to happen above the +1 MVRV pricing band? The reason could lie in the fact that when the MVRV attains values this high, the investors are holding considerable profits, so they are more likely to participate in a mass selloff. BTC Price Bitcoin witnessed a retest of the +0.5 pricing band earlier, but the level has continued to hold so far, as the coin has rebounded to $69,500 since then. Featured image from Dall-E, Glassnode.com, chart from TradingView.com
Jun 30, 2024 12:05

Analyst John Bollinger Foresees More Consolidation For Bitcoin

In the last week, the price of Bitcoin took a significant nosedive, recording a 7% loss to trade as low as $59,478. According to data from CoinMarketCap, Bitcoin attempted a rebound following this dip but has since been stuck in consolidation between $60,100 – $62,300. Commenting on this development, John Bollinger, inventor of the Bollinger Bands, a popular technical momentum indicator, has provided potential insights into Bitcoins next movement as investors continue to await the much-expected crypto bull run. Related Reading: Market Tremors: $10 Billion in Bitcoin Dumped in May Alone, What Does This Signal? Bitcoin To Remain In Consolidation, Bollinger Says In an X post on June 28, Bollinger predicted the price of Bitcoin will maintain its current range-bound movement. The prominent analyst made this projection based on the absence of a price bound following a two-bar reversal at the lower Bollinger Band.   For context, the Bollinger Bands consist of three lines (bands) namely a Middle Band which is typically a 20-day moving average of the assets price, and an upper and lower band which represent the SMA plus and minus two standard deviations of the price respectively. The Bollinger Bands are primarily used for trend identification and for indicating potential breakouts and breakdowns.  Notably in trading, a two-bar reversal is a candlestick pattern showing a potential change in price direction. When this pattern occurs at the lower Bollinger Band, it often suggests that the asset might experience a bounce or a reversal to the upside due to being oversold. However, in the current case of Bitcoin in which there is no price gain following this development, it can indicate continued weakness or price indecision which may cause BTC to remain in consolidation. Generally, such sideways price movements are driven by bearish or uncertain sentiments leading to a lack of buying pressure from investors even at lower prices. In addition, this absence of price bounce also indicates that the current lower Bollinger Band represents a weak support level increasing the risk of a price breakdown. Related Reading: Is The Bitcoin Bottom In? Crypto Expert Predicts Bullish Price Reversal BTC Price Overview At the time of writing, the price of Bitcoin continues to trade at $60,629 with a 1.31% decline in the last day. However, the assets daily trading volume is up by 15.95% and is currently valued at $24.8 billion. Notably, Bitcoin lost 11.69% of its value in June as its price dipped below $60,000. However, despite this decline, investors remain resilient in their expectations of a price rally to kick-start the crypto bull season. Notably, a crypto whale recently bought 20,200 BTC at $1.23 billion, showing much confidence in the tokens ability to stage a price rebound and embark on a bullish run. BTC trading at $60,750 on the 4-hour chart | Source: BTCUSDT chart on Tradingview.com Featured image from Shutterstock , chart from Tradingview

Bitcoin reclaims blockchain dominance post-BTC halving

Author: Cointelegraph by Josh O'Sullivan
United States
Jun 22, 2024 12:00

Bitcoin reclaims blockchain dominance post-BTC halving

Bitcoins blockchain bandwidth usage surpasses 90% post-halving, driven by new token standards and increased transaction volume.

May 09, 2025 12:10

Bitcoin Price Flashes Signal That Has Led To A Surge Every Time

The Bitcoin price action has once again caught the attention of the broader crypto market, as it flashes major bullish signals that have, without fail, led to significant rallies throughout this cycle. Building on this technical signal, a crypto analyst has forecasted that Bitcoin could mirror historical trends and potentially surge to a new all-time high.  Bollinger Band Signal Hints At Bitcoin Price Rally A closer look at Bitcoins weekly chart presented by Bitcoinsensus on X (formerly Twitter) reveals a critical pattern that has only appeared four times since 2022. Each occurrence has marked the beginning of a strong upward movement in Bitcoins price, making this a highly bullish setup. Related Reading: Elliot Wave Theory Shows Where Bitcoin Is In This Cycle Bull Rally Over? The signal in question is the Bollinger Bands, which is known to identify potential reversal zones. The analysis shows that Bitcoin has recently touched the lower Bollinger Band on the weekly chart and bounced upward, confirming a support level that historically acted as a springboard to sustained bullish momentum.  This marks the fifth time this specific signal has occurred during this cycle. Each of the past four signals, highlighted by the white circles on the chart, was followed by strong price rallies.  Notably, in early 2023, Bitcoin rallied from below $2,000 to over $30,000 following the appearance of this Bollinger Band signal. A similar pattern played out in mid-2023 when this setup triggered a surge that pushed Bitcoin above $45,000. Later that year, the same signal preceded a breakout, with BTC soaring past $60,000. Most recently, in early 2024, the Bollinger Band signal sparked a parabolic run above $100,000.  Now, in Q2 of 2025, Bitcoin is once again flashing this historically reliable indicator. Its price found strong support near the $77,500 level, with resistance levels set above $106,000. As the Bollinger Bands align, Bitcoinsensus predicts a potential rally toward $130,000 – $160,000. This would mark a historical all-time high for Bitcoin, representing a maximum increase of over 46.7% from its current ATH above $109,000.  BTC Poised For Breakout As Price Nears $100,000 Again The Bitcoin price is once again approaching the $100,000 mark after its latest 4.75% surge this past week. Amidst its price recovery, crypto analyst Trader Tardigrade predicts that Bitcoin will soon break out of bearish resistance to reach new highs. Related Reading: Bitcoin Raging Bull Indicator Turns Back On, But This Level Holds The Key The analyst shared a BTC chart analysis highlighting a recurring breakout pattern that has historically preceded large upward moves after a breakout from a descending resistance trendline. This pattern has emerged three times in the past: first from late 2022 to early 2023, then from mid-2023 to early 2024, and finally from late 2024 to early 2025. In the current setup, Bitcoin is once again testing the descending trendline resistance and appears to be breaking out from it. If history is any indication, the analyst projects a potential target zone between $100,000 – $136,000, marking a new ATH. Featured image from Pixabay, chart from Tradingview.com

May 06, 2025 05:50

OpenAI pledges to remain a non-profit organization and abandon plans for major restructuring

OpenAI has announced its decision to remain a nonprofit organization, abandoning its previous plans to convert into a for-profit entity. The company, known for its groundbreaking work in artificial intelligence (AI) development, had initially considered transitioning to a commercial model. However, after careful consideration, OpenAI has opted to stay true to its core mission of [...]

XRP/BTC Chart Signals Possible Upside: 30% Surge Possible?

Author: Paul Adedoyin
Estonia
May 05, 2025 02:35

XRP/BTC Chart Signals Possible Upside: 30% Surge Possible?

Analyzing Bollinger Bands, MACD, and trading volume suggests that an XRP/BTC rally could happen soon.

Bitcoins Unmatched Soaring Trajectory: 50 Years of Trading Wisdom Revealed

Author: Aishwarya shashikumar
Estonia
May 05, 2024 02:30

Bitcoins Unmatched Soaring Trajectory: 50 Years of Trading Wisdom Revealed

Bitcoin takes center stage as veteran commodities trader Peter Brandt celebrates his 50th trading anniversary. In a recent blog post, Brandt reflects on his journey spanning half a century in trading, observing the evolution of markets since 1971. For Brandt, whose initial trade involved futures contracts of pre-1964 Silver quarters and dimes, BTC represents a […]

May 18, 2024 12:05

Analyst Utilizes Supply And Demand Principles To Determine Bitcoin Price

For analysts and investors alike, comprehending the variables that influence price action in the complex world of cryptocurrency markets is essential. Ali Martinez, a well-known cryptocurrency expert, has recently provided insights into the fluctuations in the price of Bitcoin by applying the basic economic theory of supply and demand.  Understanding Bitcoin Prices Through Supply And Demand It is worth noting that any asset’s price movement, including cryptocurrencies, is determined by the fundamental rules of supply and demand. An asset’s price tends to decrease when supply outpaces demand, while prices typically increase when supply cannot keep up with demand.  Related Reading: The Hidden Forces Behind Bitcoin Price: Latest Insights From On-Chain Data Thus, Ali Martinez has deduced the crypto asset’s price and holders’ behaviour by applying the method and other on-chain metrics. Martinez’s analysis demonstrates how fluctuations in the market’s buying interest and the availability of Bitcoin are key factors influencing its price trajectory. According to Martinez, Bitcoin’s Realized Cap witnessed a significant increase mid-way through March when BTC hit a new all-time high of $73,000. This indicated that the majority of BTC’s long-term holders were likely yielding gains at the time. As a result, several investors sold their holdings, which led to a sharp rise in realized profits. Following realized profits in March, long-term holders felt safe adding over 70,000 BTC to their investments at these prices. Meanwhile, when the market’s growing supply of Bitcoin exceeded demand, the coin saw a substantial correction from the $73,000 level to the $57,000 level.  Given that short-term holders are more likely to sell their holdings due to price volatility, this decline took Bitcoin below its realized price for short-term holders, inciting fear in the market. However, despite investors’ concerns, the short-term holder’s Realized Price at the $65,500 level acted as an accumulation point. On the basis of this principle, Martinez believes the likelihood of Bitcoin continuing its upward trajectory will only increase when demand for the cryptocurrency starts to exceed the supply of BTC accessible in the market. Using BTC On Exchanges To Support The Principles Martinez has underscored that the available BTC on crypto exchanges can be used to confirm these supply and demand laws. He further noted that over 30,000 BTC have been moved to private wallets for long-term storage in May, indicating confidence among holders in the potential worth of Bitcoin. Related Reading: Bitcoin Long-Term Holders Accumulating Like In 2021: Is BTC Ready For A 15X? Observing Bitcoin’s price using the MVRV Extreme Deviation Pricing Bands, Martinez cited a retracement above the +0.5 pricing band at $64,600. Such an upswing has historically caused BTC to test the pricing range of 1.0, which is backed by increasing demand. Meanwhile, this price range at the moment is roughly lingering at $77,000. Presently, the price of Bitcoin is trading at $66,275, indicating an over 5% increase in the past week. Although prices are up, its trading volume has declined by 24%, while its market cap is up by 0.23%. Featured image from iStock, chart from Tradingview.com

May 16, 2025 12:05

Is Bitcoin Price Turning Bullish Or Bearish? Crypto Analyst Reveals Critical Levels To Watch

Bitcoin’s price action in the past 24 hours has seen it slowly retracing from the $104,000 zone it started the week at. This range has become particularly significant as Bitcoin continues to flirt with levels last seen during its recent push toward new all-time highs. Bitcoin’s price movements over the past two days have tightened, and the candlestick behavior on the weekly chart has led to a doji formation on the weekly candlestick timeframe, an indicator of indecision. Interestingly, a technical analysis from crypto analyst Tony “The Bull” Severino has highlighted critical levels to watch that will determine whether the Bitcoin price is turning bearish or still bullish.  Mixed Signals: Why the Current Resistance Zone Is Critical Crypto analyst Tony “The Bull” Severino shared a chart and in-depth breakdown on the social media platform X, pointing to horizontal support and resistance levels as the most important technical indicators in his view. As shown on his Bitcoin weekly chart, the leading cryptocurrency is now pressing against a well-defined resistance zone just below its all-time high, marked clearly in red. The proximity of this level to its all-time high means it could act as a ceiling, making it an important area to watch for either a breakout or a reversal. Related Reading: Whats Driving The Bitcoin Price Recovery Above $100,000 And Is It Sustainable? Tony outlines three possible interpretations for the current market structure around the $108,000 resistance level. The bullish case hinges on Bitcoin consolidating under resistance, a pattern often followed by upward continuation. The neutral case is that Bitcoin could be forming a broad trading range, in which case it makes sense to short the market at resistance while buying near support. On the bearish side, the presence of a doji candlestick at this key level may be a sign of fading momentum and an early signal of a price reversal. His trading strategy reflects this uncertainty. He has placed short positions within the red resistance zone, with a stop loss just above the all-time high. At the same time, he has set a stop buy order in the green breakout zone above the all-time high, ready to switch long should the Bitcoin price convincingly break through resistance. Conditions For A Bullish Breakout Are Not Yet Fulfilled Although Tony noted that the broader investment market, including altcoins and the stock market, looks strong, he cautioned that this does not guarantee a bullish breakout for Bitcoin. For confirmation, a bullish breakout must be preceded by aligning various technical indicators. These include a breakout with substantial trading volume, an RSI reading above 70 on the weekly chart, and a weekly close above the upper Bollinger Band.  Related Reading: The Big Short Coming For Bitcoin? Why BTC Will Clear $110,000 At the moment, however, the Bitcoin CME Futures chart has failed to move past 70 on the daily RSI twice, and trading volume is in decline. According to CoinMarketCap, the trading volume of Bitcoin is $44.33 billion in the past 24 hours, a 11.40% reduction from the previous 24 hours. These are early warning signs that a breakout attempt may lack the strength needed for sustainability. Nonetheless, the conditions are still very mixed and starting to lean more bullish than bearish. At the time of writing, Bitcoin is trading at $102,352, down by 1.31% in the past 24 hours. Featured image from Pixabay, chart from Tradingview.com

Ethereum MVRV Pricing Bands Show Key Resistance Around $3,100 Level  Details

Author: Sebastian Villafuerte
United Kingdom
May 15, 2025 12:05

Ethereum MVRV Pricing Bands Show Key Resistance Around $3,100 Level Details

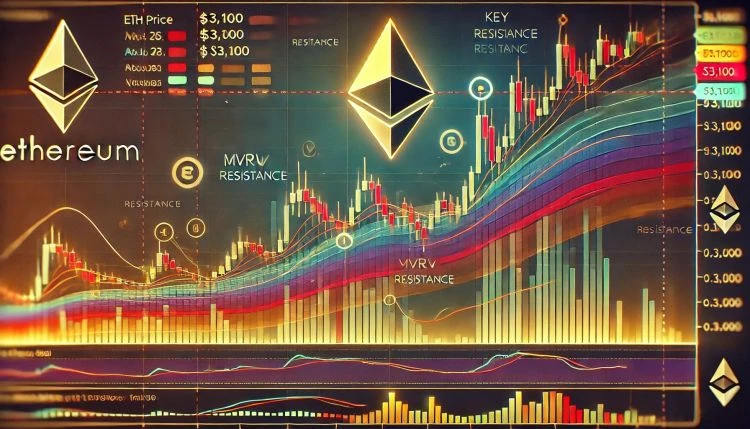
Ethereum is trading firmly above the $2,600 mark after a surge in buying pressure over the past several days, marking a strong shift in momentum across the broader market. After months of choppy action and bearish sentiment, bulls are clearly back in control. ETH has reclaimed several key levels with conviction, signaling a potential continuation toward higher targets. Related Reading: XRP Open Interest Surges 41% As Speculation Grows Over $1B Added In Just One Week Price action now looks structurally bullish, with Ethereum pushing through resistance zones that previously capped upside for weeks. This rally has reignited investor confidence and brought renewed attention to Ethereums medium-term outlook, especially as altcoins start to show strength alongside Bitcoins recent consolidation. According to fresh data from Glassnode, the next major resistance area to watch is at $3,100, where Ethereum is likely to encounter heavier sell pressure. This level, derived from pricing bands, now defines Ethereums current trading range and will likely dictate price direction in the coming sessions. With volatility returning and sentiment improving, Ethereum appears poised for a critical breakout or a decisive retest of support, depending on how bulls handle the next leg. Ethereum Nears Key Resistance As Altseason Expectations Grow Ethereum has rallied over 98% since its April 9th low, marking one of its most powerful recoveries in recent years. This explosive move has not only flipped sentiment from bearish to bullish, but also reignited speculation around a broader altseason a period in which altcoins significantly outperform Bitcoin. After months of heavy selling pressure that began in late December, Ethereum is now showing sustained strength for the first time. The price has reclaimed critical levels, and momentum continues to build as traders and investors rotate capital back into ETH and other large-cap altcoins. Market participants are watching closely to see if Ethereum can maintain this pace and confirm a longer-term trend reversal. Top analyst Ali Martinez shared Ethereums MVRV Extreme Deviation Pricing Bands, offering a clear technical framework for whats next. According to the data, the next key resistance level is at $3,100 a region that could act as a short-term ceiling if buying pressure fades. On the downside, the major support zone sits at $2,233, a critical level to hold in the event of a pullback. As Ethereum continues to climb, these levels will become increasingly important. A clean breakout above $3,100 could open the door to a broader rally across altcoins, while a rejection or correction would likely test the markets true conviction. For now, ETH remains in a bullish structure, supported by growing volume, on-chain signals, and renewed investor enthusiasm. The coming days will be crucial in determining whether Ethereum leads the charge into a full-fledged altseason. Related Reading: Solana Network Activity Grows As 11M Wallets Now Hold 0.1 SOL Or More Analyst ETH Price Action: Testing Resistance After Massive Rally Ethereum (ETH) is currently trading around $2,604, consolidating after a sharp surge that lifted it from under $1,400 to a high of $2,725 in just two weeks. The daily chart shows that ETH is now approaching the 200-day simple moving average (SMA) at $2,702.60, which is acting as a key resistance level. This zone also coincides with recent local highs from early February, making it a critical area to break for further upside continuation. The recent rally brought strong volume and bullish momentum, with ETH closing multiple daily candles above the 200-day exponential moving average (EMA) at $2,435.66. This is a positive sign for trend reversal after months of sustained bearish pressure. However, todays pullback signals that bulls are losing some steam as the price tests this crucial resistance. Related Reading: Ethereum Recovery Gains Strength: Massive Comeback Above Key Support If ETH can consolidate above the $2,500$2,600 range and break through the 200-day SMA with convincing volume, the next upside target lies near the $3,100 level, as noted in recent technical studies. On the downside, maintaining support above $2,435$2,450 is essential to avoid a deeper correction. The coming days will reveal whether Ethereum can turn this consolidation into a true breakout or if further cooling is needed before the next leg up. Featured image from Dall-E, chart from TradingView

Solanas Bollinger Bands Are Squeezing: Big Move Incoming?

Author: Paul Adedoyin
Estonia
May 01, 2025 02:30

Solanas Bollinger Bands Are Squeezing: Big Move Incoming?

The gap Solanas Bollinger Bands are reducing, which is a sign that its price is about to change.

Apr 28, 2025 12:10

XRP Risks Falling To $1.25 Without Critical Price Break Analyst

Market analyst Egrag Crypto has tipped XRP to fall to $1.25 in the short term, barring a specific price development. Despite a bullish trading week, which saw the altcoin trade at $2.29, the market expert explains that XRP is yet to confirm a market bottom, indicating the potential of a future price fall. Related Reading: SUI Primed For Market Correction Analyst Sets Target At $2.75 Crucial Times Ahead: XRP Must Break $2.33$2.45 To Invalidate Bearish Forecast  In an X post on April 26, Egrag Crypto shared a bearish forecast on the XRP market, suggesting a potential downswing lies on the horizon. Based on the technical analysis of the XRP trading chart, altcoin appears to be trading below the Bull Market Support Band despite recent gains due to the extensive price correction in Q1 2025. For context, the Bull Market Support Band is a price zone formed from two moving averages to help traders detect whether an asset remains in a bull market or not. When prices fall below this support band, it often signals a bear market risk. For XRP to invalidate this negative forecast, the fourth-largest cryptocurrency must close above $2.33, which represents the immediate resistance level. Importantly, XRP must reclaim the $2.45, which currently acts as the upper edge of the Bull Market Support Band.  Achieving a decisive close above both critical price levels would signal a strong market demand and reduce fear of a larger price correction. However, if XRP fails to break above this band soon, the 0.702 Fibonacci level around $1.25 becomes a likely potential target.  Egrag Crypto explains that this Fibonacci level aligns with the previous breakout structure, thus making it a strong historical support. However, a price fall to $1.25 would only constitute a major retest, which could reinforce the long-term bullish structure of the XRP market. Related Reading: Ethereum Price Reaches Last H1 Support, Next Major Resistance Comes Into View XRP Price Overview At the time of writing, XRP trades at $2.18, reflecting a decline of 0.78% in the last day. The prominent altcoin is also down 5.08% on the monthly chart, indicating that bearish pressures are still strong in the market. According to data from Coincodex, market sentiment currently remains neutral, with investors still uncertain of XRPs future. Notably, only 40% of XRPs last 30 trading days have been profitable. Interestingly, Coincodex analysts expect the asset to retain its recent bullish form in the short term to potentially trade at $2.50 in five days. However, they remain highly bearish on long-term prospects, projecting a price of $1.97 in one month and $1.65 in three months. Featured image from iStock, chart from Tradingview

Apr 27, 2025 02:30

Ripple (XRP) at a Crossroads: Hold 0.702 Fib or Risk a Sharp Drop to $1.25

Ripple (XRP), the fourth-largest cryptocurrency by market cap, is at a critical juncture as technical analysis points to a potential short-term correction. XRP is trading at $2.19, with a 24-hour trading volume of $3.2 billion, according to CoinMarketCap. The token has seen a 5.7% increase over the past week, reflecting strong momentum fueled by recent […]

Ethereum Enters Historic Buy Zone As Price Dips Below Key Level  Insights

Author: Sebastian Villafuerte
United Kingdom
Apr 21, 2025 12:10

Ethereum Enters Historic Buy Zone As Price Dips Below Key Level Insights

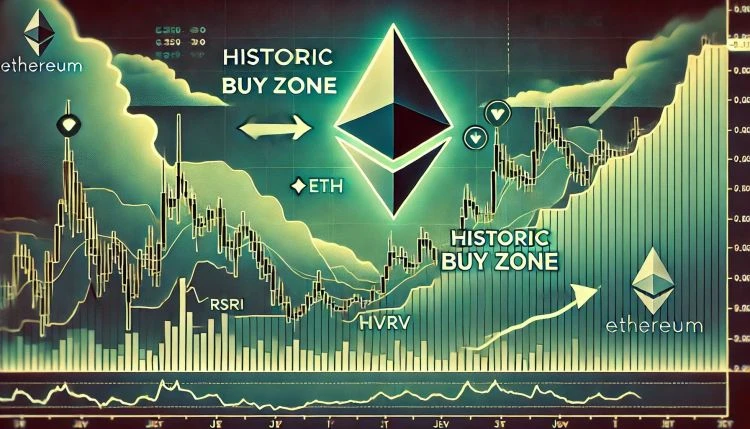
Ethereum is currently trading at a critical resistance level as bulls attempt to regain momentum and push for a fresh high. The broader market remains under pressure as global uncertainty escalates, largely fueled by ongoing trade tensions between the United States and China. Last week, US President Donald Trump announced a 90-day tariff pause on all countries except China, intensifying concerns about an extended trade conflict that could destabilize global financial markets. Related Reading: Ethereum Trades At Bear Market Lows: Fundamentals Signal Major Undervaluation In this high-stakes environment, Ethereums price action is drawing close attention from investors and analysts. Top crypto analyst Ali Martinez shared that historically, the best Ethereum buying opportunities have emerged when the price drops below the lower MVRV (Market Value to Realized Value) Price Banda level that signals potential undervaluation. Notably, ETH is now trading precisely in that zone. This alignment between technical conditions and macroeconomic instability suggests that Ethereum could be entering a phase of accumulation, with long-term investors looking to capitalize on discounted prices. However, sustained upward momentum will depend on whether bulls can overcome immediate resistance and whether macro conditions improve. The coming days could prove pivotal for ETH as it tests both technical and psychological thresholds. Ethereum Dips Into Historical Opportunity Zone Ethereum is currently trading below key resistance levels after enduring several weeks of selling pressure and weak market performance. Since losing the crucial $2,000 support level, ETH has fallen roughly 21%, a clear indication that bulls have yet to regain control. Broader macroeconomic pressures, especially rising global tensions and uncertain trade conditions between the US and China, have further dampened market sentiment. These conditions have driven many investors to exit riskier assets like cryptocurrencies, leading to elevated volatility and reduced market participation. Despite this downtrend, some analysts believe Ethereum could be nearing a pivotal turnaround zone. According to Martinez, one of the best historical signals for Ethereum accumulation has been price action dipping below the lower bound of the MVRV Price Banda metric that compares market value to realized value to assess whether an asset is over- or undervalued. Currently, Ethereum is trading beneath that lower band. Martinez emphasizes that this positioning has typically preceded strong upside reversals, especially during periods of extreme market pessimism. While short-term volatility may persist, ETHs entry into this zone could present a rare opportunity for long-term investors to accumulate at historically discounted levelsif market conditions stabilize and sentiment shifts. Related Reading: Cardano Whales Offload 180 Million ADA In 5 Days Smart Profit-Taking? ETH Stalls In Tight Range Ethereum is currently trading at $1,610 after nearly a week of low volatility and sideways action. Since last Tuesday, ETH has remained locked in a tight range between $1,550 and $1,630, reflecting the markets uncertainty and hesitation to take a clear directional stance. This narrow trading zone highlights a period of price compression, often a precursor to a larger move in either direction. For bulls to regain momentum and shift sentiment, Ethereum must reclaim the $1,700 level and push decisively above the $2,000 mark. These levels not only serve as key psychological barriers but also represent critical zones of previous support that have now turned into resistance. A breakout above $2,000 would likely trigger renewed buying interest and set the stage for a potential recovery rally. Related Reading: Ethereum Price Stalls In Tight Range Big Price Move Incoming? However, if bearish pressure builds and the $1,550 floor is breached, Ethereum could quickly test the $1,500 support zone. A breakdown below that level would confirm further downside risk, potentially accelerating sell-offs and deepening the current correction. Until a breakout or breakdown occurs, traders should prepare for more consolidation and volatility as the market awaits a macro or technical catalyst. Featured image from Dall-E, chart from TradingView

Apr 18, 2024 01:50

Band Protocol Price Prediction for Today, April 16 BAND Technical Analysis

The Band Protocol price prediction shows that BAND could renew the bullish trend after testing the support level of $1.34 today. Band Protocol Prediction Statistics [...]

Apr 12, 2025 05:50

Democrats criticize DOJs decision to disband crypto crime unit as a grave mistake

In a recent development, Democratic senators have criticized the Department of Justice (DOJ) for its decision to shut down a specialized unit focused on investigating crypto-related crimes. The move has sparked concerns among lawmakers regarding the DOJ’s commitment to combating illicit activities in the cryptocurrency space. The Senate Democrats expressed their dismay over the closure [...]

The post Democrats criticize DOJ’s decision to disband crypto crime unit as a ‘grave mistake’ appeared first on Crypto Breaking News.

Your Crypto Gateway

Claim 1,000
Free WCG Coins

World Crypto Global opens the door to digital freedom for everyone.
Manage your free WCG Coins securely—where simplicity meets global accessibility.

11 bn

FREE CRYPTO COINS

8.9 bn

AVAILABLE FOR RESERVATION

2.1 bn+

ALREADY ALLOCATED

× WCG Coin

🎉 Get 1,000 WCG Coins

No fees. No catch. Your crypto journey starts here.