Base hits 4M active addresses amid Onchain Summer campaign
Base said it had allotted 600 ETH, worth $2 million, for developers who would build on the blockchain from June to August this year.
Loading
Welcome at World Crypto Global. This portal is packed with useful content and resources to built out your own crypto skills. WorldCrypto is a site member of Gabriel Vega Network.

Base said it had allotted 600 ETH, worth $2 million, for developers who would build on the blockchain from June to August this year.
While Bitcoin saw a 20% drop in daily active addresses in Q2 2024, Ethereum and L2s posted a 127% increase in such addresses in H1 2024.
On-chain data shows XRP is observing a spike in its adoption and network activity. Here’s what this could mean for the asset. XRP New Addresses & Active Addresses Have Both Spiked According to data from the on-chain analytics firm Santiment, XRP has seen two metrics hit the highest levels since March recently. The first indicator [...]
The post XRP Adoption & Activity Spike: What This Means For Its Price appeared first on Crypto Breaking News.
The price of Litecoin (LTC) has had a disappointing performance in the second quarter of 2024, despite making a positive start to the year. The cryptocurrency has been facing significant bearish pressure in the past day, with its price falling by nearly 5% in a single move. Despite LTCs apparent struggles in terms of price action, its network has witnessed remarkable growth in recent weeks. LTC Addresses Spike By 75% In A Single Day According to data from the on-chain analytics firm IntoTheBlock, activity on the Litecoin blockchain has been on the rise lately. On Thursday, June 8th, the number of active addresses on the network surged by over 75% to claim above 600,000. Related Reading: Is A Bitcoin Crash Below $50,000 Still Possible? Crypto Analyst Shares The Possibilities IntoTheBlock revealed – via a post on the X platform – that this latest spike in addresses pushed the Litecoin network to a new high since January. This suggests increased interest in the LTC blockchain despite its coins price struggles. When the number of addresses with a balance increases, it implies the entry of fresh investors or the return of old owners to a blockchain (Litecoin, in this case). It is often a strong indication of net adoption or rising faith in a particular network. Interestingly, the crypto intelligence firm highlighted that this recent growth spurt has propelled Litecoin ahead of the smart contract platform Ethereum in terms of active addresses. The network is well ahead of Ethereum by at least 100,000 addresses, according to IntoTheBlock. The number of active addresses is not the only area in which Litecoin has seen growth in the past day. The volume of transactions also experienced a significant increase. According to IntoTheBlocks data, the number of LTC transactions surpassed 426,000 on Thursday. The on-chain analytics platform noted: While most of the increase is due to transactions smaller than $10, there is a noticeable rise in transactions of all sizes. Impact On Litecoin Price Strong fundamentals and network growth have been known to drive the price of crypto assets in many scenarios. In simple terms, an increase in network activity and users often translates to an increase in the networks valuation. Related Reading: Injective (INJ) Price Set To Skyrocket 33% On Classic Bullish Signal: Crypto Analyst However, the impact of network fundamentals on asset prices is never straightforward. In Litecoins case, there has been no significant positive development in its price since the latest on-chain revelation. As of this writing, the price of LTC stands around $80.28, reflecting a 4.5% decline in the past day. Featured image from Getty, chart from TradingView
Solana (SOL) has had a turbulent time lately evident with a consistent decline in its market price. According to data from CoinMarketCap, the Ethereum Killer is down by 6.36% on its weekly chart, emerging as the biggest loser among the top 10 tokens. Interestingly, this price dip depicts the larger negative performance of SOL in which it has lost 24.61% of its value in the last month. However, amidst this mayhem, the Solana network has hit a significant milestone which may spark some excitement for investors. Related Reading: Solana Could Face A 41% Crash, Warns Mechanism Capital Co-Founder Solana Records All-Time High Of 30 Million Monthly Users In an enthralling development for SOL enthusiasts, data from blockchain analytics platform Artemis shows the network has attained a new peak of 30 million active addresses (users). This development was shared on X on Friday by the data analysis handle SolanaFloor. After reaching the 25 million mark in 2022, the Solana blockchain experienced a steep decline in monthly active users going as low as 5 million in 2023. However, the smart contract platform has appeared rather attractive in 2024 with a steady rise in monthly users throughout the year so far. In the crypto ecosystem, the importance of growth in network users stems mainly from an indication of growing market confidence from investors, which is quite vital considering SOL’s current price dip. For the fifth largest cryptocurrency, this rise in the active addresses is likely due to the current hype around Solana meme coins – a $5.65 billion ecosystem that has provided investors with an avenue of recording insane trading profits. In addition, an increase in network users can also translate into larger liquidity, more stable network security, and the development of more use cases, all of which are important features in attracting further investment and boosting a tokens value. Related Reading: Bitcoin And Solana Brace For Quiet Q3: What Crypto Traders Should Know What’s Next For SOL? At the time of writing, SOL trades at $133.36 following a 0.34% decline in the last day. Furthermore, the tokens daily trading volume is down by 6.81% and valued at t $2.19 billion. For Solana, the bulls face strong resistance at the $151 price zone. If the buying pressure proves sufficient to push through this region. SOL could return as high as $190 over the next few weeks. However, a rejection at this zone could result in a further decline in the tokens price reaching as low as $120. All traders are reminded to perform due diligence before engaging with the cryptocurrency market. Featured image from The Independent, chart from Tradingview
Toncoin (TON), the native token of The Open Network, has had one of the best performances this cycle. The token has hit a new all-time high (ATH) twice this Friday and flipped Ethereums active users this week. Market watchers believe this breakout and recent performance could set the stage for a rally toward the $10 [...]
The post Toncoin (TON) Hits New ATH, Is $10 The Next Stop? appeared first on Crypto Breaking News.
Toncoin (TON), the native token of The Open Network, experienced a 12% price drop from its recent all-time high of $7.76 over the past week, following the overall market correction led by Bitcoin (BTC). However, despite the temporary setback, the optimistic sentiment surrounding TON and its network has led crypto analysts to speculate on a [...]
The post Toncoin (TON) Flips Ethereum In Daily Active Users, Fueling $10 Price Target Predictions appeared first on Crypto Breaking News.
Ethereum (ETH) is showing promising signs of a potential recovery after bearish pressures have persisted for several months. The second-largest digital currency by market capitalization is well-positioned to capitalise on several key factors. On the technical front, signal part there are signs of positive tren,d and on the demand side, higher institutional buying continues. These […]
On-chain data shows the XRP active addresses metric has spiked to historical levels recently, a sign that may turn out to be bullish for the asset. XRP Daily Active Addresses Has Observed An Uplift Recently According to data from the on-chain analytics firm Santiment, address activity on the network reached its second and third-highest values [...]
The post XRP Bullish Signal: Address Activity Spikes To Historical Levels appeared first on Crypto Breaking News.
Blockchain protocol MakerDAO (MKR) continues to see significant gains, maintaining a strong upward trend throughout the year. MKR has seen significant growth of over 358%, accompanied by positive metrics reflecting increased adoption and usage of the protocol. In addition, upcoming voting initiatives aim to further increase the platforms benefits for its stakeholders. MakerDAO Announces Plans For [...]
The post MakerDAO Stakeholder-Focused Updates Drive MKR Price Up By 10% appeared first on Crypto Breaking News.
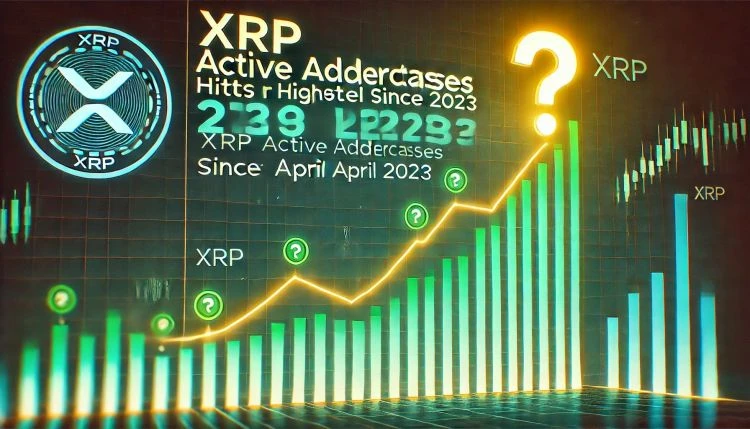
XRP is trading above crucial support levels and showing signs of strength as the broader crypto market struggles with persistent selling pressure and macroeconomic headwinds. While many digital assets have suffered steep corrections in recent weeks, XRP has remained one of the most resilient performers, holding above key technical zones and attracting growing investor interest. Related Reading: Ethereum Trades At A Critical Level Major Reclaim Or Steep Drop Ahead? With market sentiment slowly recovering, many traders are eyeing XRP as a potential leader in the next wave of gains. Analysts believe that once the market stabilizes, XRP could be among the first altcoins to rally back toward previous highs. This optimism is supported by fresh on-chain data. According to metrics from Glassnode, the XRP network has recorded nearly 627,000 active addresses. This surge in network usage suggests growing interest and adoption, a bullish sign that often precedes price acceleration. High address activity typically indicates more users interacting with the network, whether through transactions, accumulation, or trading. If the broader market conditions improve, this spike in activity could fuel further upside for XRP. As it stands, XRP is positioned well above its key support range and looks primed for a breakout once bullish momentum returns to the market. XRP Network Activity Surges Bulls Defend Key Levels Macroeconomic uncertainty and surging volatility continue to shake both the crypto and equities markets, fueling widespread fear and triggering panic selling across asset classes. U.S. trade war concerns, inflationary pressure, and erratic policy moves have kept investors on edge, leading to deep corrections in most cryptocurrencies. Yet, amid this uncertainty, XRP stands out with surprising resilience. Related Reading: Dogecoin Forms A Daily Bullish Pattern Analyst Expects A Breakout To $0.43 Compared to leading altcoins like Solana and Ethereum, which have both suffered notable losses, XRP remains at a strong technical level. Bulls have managed to defend key demand zones, and the current focus is on reclaiming critical supply areas to validate a new uptrend. The assets ability to hold support despite market-wide weakness has caught the attention of analysts and investors alike. Top analyst Ali Martinez shared on-chain data from Glassnode, revealing that XRPs network activity is surging. With nearly 627,000 active addressesthe highest since April 2023XRP shows signs of renewed adoption and usage. Historically, spikes in active addresses correlate with bullish momentum, as rising participation typically reflects investor confidence and transactional demand. If XRP maintains its support base and continues to show strength in network fundamentals, it could be one of the first altcoins to break out once market sentiment recovers. The rise in active addresses may be an early indicator that a larger move is on the horizon. Price Holds Strong After Small Rally Eyes Set on $3 Breakout XRP is trading at $2.41 after a volatile few days of sharp swings between support and resistance. The token surged over 33% from its recent low at $1.89, showing strong bullish momentum despite market-wide uncertainty. This rebound has placed XRP among the top-performing assets in the crypto space, attracting renewed attention from traders and analysts. The $2.30 level now stands as a key short-term support zone. If XRP holds above this level, bulls are likely to push toward the psychological $3 mark, which also aligns with a historical resistance area. A clean breakout above $3 could open the door for a rally toward range highs and potentially new all-time highs, depending on broader market sentiment. However, if XRP fails to maintain support at $2.30, a pullback into lower demand zones around the $2.00 or even $1.89 levels is possible. This would likely slow the pace of any recovery and increase selling pressure in the short term. Related Reading: On-Chain Data Signals Key Test For Solana At $135 Level Insights For now, XRPs price structure remains bullish, but maintaining momentum will depend on holding above key levels as the broader market stabilizes. All eyes are on the next move. Featured image from Dall-E, chart from TradingView
Dogecoin (DOGE) is facing a critical moment, having lost over 40% of its value since the start of March. The entire crypto market is under intense selling pressure, driven by macroeconomic uncertainty and heightened volatility. However, meme coins like DOGE have been hit the hardest, as bears continue to short them aggressively, pushing prices lower with no signs of relief. Related Reading: Bitcoin Lost And Retested The 200-Day MA As Resistance Heres What Happened Last Time Despite the heavy downturn, on-chain data suggests potential signs of recovery. Glassnode metrics reveal that Dogecoin network activity is surging, with a 47% increase in active addresses over the past month. Historically, increased network usage and transaction activity can indicate renewed interest and potential accumulation by long-term holders. If this trend continues, DOGE could see a rebound once market conditions start to improve. However, bulls still have a lot of work to do to regain lost ground and push Dogecoin back into a bullish trend. The coming days will be crucial, as traders closely watch whether network growth can translate into price stability or if further downside is ahead for DOGE and the broader meme coin sector. Dogecoin Down 70% As Network Activity Shows Grows Dogecoin has suffered a brutal sell-off, now trading 70% below its December high as selling pressure remains relentless. Meme coins, in general, have been the most affected assets in the market, as fear and speculation drive investors away from high-risk assets. With DOGE failing to find strong support, bulls have a lot of work to do before any meaningful recovery can take place. Related Reading: New ONDO Addresses Surge 390% In 24 Hours A Sign Of Growing Interest In Ondo Finance The broader crypto market downturn has only added to the struggles. Bitcoin (BTC) has been in a downtrend since late January, and as fear continues to spread, investors are lowering their expectations and setting even lower targets. If this truly marks the end of BTCs bull cycle, meme coins like Dogecoin will be among the hardest hit, as speculative assets tend to suffer the most in bearish conditions. However, not all signals are negative. Analyst Ali Martinez shared on-chain data on X, revealing that Dogecoins network activity is increasing. Active addresses have surged by 47% in the past month, rising from 110,000 to 163,000. Historically, rising network activity has often preceded a recovery in price, as it indicates renewed interest and engagement in the ecosystem. While DOGE still faces significant resistance, this spike in activity could be an early sign that buyers are returning. If Bitcoin stabilizes, the meme coin sector could see a relief bounce, potentially leading Dogecoin back toward key resistance levels. For now, DOGE remains under pressure, but its growing network activity provides a glimmer of hope for bullish traders watching for a turnaround. Dogecoin Struggles At $0.17 As Bears Maintain Control Dogecoin is currently trading at $0.17 after enduring massive selling pressure and a dramatic shift in market sentiment toward fear. The broader crypto market downturn has hit meme coins the hardest, with DOGE struggling to find stability amid relentless sell-offs. For a potential recovery, DOGE must hold above the crucial $0.15 support level. If bulls manage to defend this zone, they could attempt a push toward the $0.20 mark, a key psychological resistance. Reclaiming $0.20 would signal a possible reversal, providing DOGE with the momentum needed to sustain a recovery rally. However, if selling pressure continues and DOGE loses the $0.15 level, the situation could become even more bearish. A break below this support could trigger a further decline toward $0.10, a level that hasnt been tested since early 2023. Related Reading: XRP Flirts With A Daily Range Breakdown Price Must Hold Above $2 Level With market sentiment still fragile, traders are closely watching whether DOGE can hold its current range or if more downside is ahead. The next few trading sessions will be crucial, as bulls must step in quickly to prevent another major drop. Featured image from Dall-E, chart from TradingView
Bitcoin addresses in profit is at a 9-month high of 30+ million. More unique addresses in profit were last above 30 million in early April 2022. Non-zero addresses also hit a 1-month high while addresses with 0.01+ BTC is at an all-time high. The number of Bitcoin addresses that are currently in profit has reached […]
The post 30 million Bitcoin addresses in profit as metric hits 9-month high appeared first on CoinJournal.
Bitcoin addresses with 100 or more coins hit 16,120 on 19 December 2022. Each address is worth $1.67 million at current prices, increasing the number of Bitcoin millionaires to the highest level since December 2021. Data also shows hodling is on the rise despite crypto winter, with 46% of BTC last active in 2+ years […]
The post Bitcoin addresses with 100+ coins reach new one-year high appeared first on CoinJournal.
Decentralized oracle network Chainlink (LINK) has been making significant strides in the altcoin market, outperforming its peers with an impressive 44.8% price increase over the past 30 days. Surging to a 24-month high, the cryptocurrency has inched closer to the $20 mark, attracting the attention of bullish investors. Notably, the uptrend for LINK may be far from over, as it can potentially record a substantial 38% price gain by breaking through a critical resistance level. Chainlink Trading Volume Skyrockets Crypto analyst Ali Martinez indicates that Chainlink faces formidable resistance between its current trading price of $19.40 and $20.03, with 5,330 addresses collectively holding over 8.59 million LINK. Despite this supply wall, if Chainlink manages to break through, Ali Martinez suggests that the next critical resistance level stands at $26.87, presenting an opportunity for a significant 38% price surge. Related Reading: XRP Price Retreats To $0.50 As Whale Unloads 30 Million Tokens Details Adding to the positive outlook, Chainlink has witnessed a surge in trading volume and an increase in circulating market cap over the past few days. Data from Token Terminal reveals that while Chainlink’s trading volume has steadily risen over the past 30 days, the token experienced exceptional trading volume of over $9.5 billion in the past three days alone. This surge in trading activity suggests a growing interest from investors in the Chainlink protocol. Examining the circulating market cap, Token Terminal data highlights a positive trend. The circulating market cap of Chainlink stands at $10.53 billion, displaying a notable increase of 32.66% over the past 30 days. In terms of fully diluted market cap, Chainlink records $18.16 billion, indicating a substantial rise of 28.89% over the same period. Institutional Interest In LINK? Recent blockchain data suggests that institutional investors are actively accumulating LINK. According to Spot On Chain data, the emergence of eight wallets withdrawing a substantial amount of LINK tokens, coupled with a price surge shortly after, indicates institutional interest in the cryptocurrency. Over the past twelve hours, eight new wallets, likely representing a single individual or institution, have collectively withdrawn 227,350 LINK tokens, equivalent to approximately $4.12 million at the withdrawal time. Notably, a significant portion of these tokens was withdrawn from centralized exchanges (CEX) just before the price experienced a sudden increase of approximately 4.1%. This pattern suggests that institutions may strategically accumulate LINK tokens, anticipating future price appreciation. Related Reading: Ethereum Rally: Crypto Analysts Outline 3 Key Drivers For Price Moreover, as indicated by its performance on the algorithmic market scanner Commando, LINK has consistently been a top performer in the cryptocurrency market. According to the market intelligence platform Decentrader, with a current score of 1.83 and a green signal on low time frames, Chainlink’s technical analysis suggests a positive outlook for the cryptocurrency. Noteworthy is the recent breakthrough of Chainlink’s price from a range held up by the 200-week moving average (200WMA). This breakout indicates a shift in market sentiment and a potential upward trend. The cryptocurrency is now aiming to target the Sniper resistance level just above $20 while finding support at the top of the previous range, around $16.8, according to Decentrader. Overall, institutions’ accumulation of Chainlink tokens and the cryptocurrency’s technical breakout point to growing confidence in LINK’s investment potential. The withdrawals from centralized exchanges suggest a desire to hold LINK tokens outside exchange custody, possibly indicating a longer-term investment strategy. Currently, LINK is trading at $19.7, up 8% in the last 24 hours. Featured image from Shutterstock, chart from TradingView.com
A sluggish Bitcoin price performance has not been the only disappointing theme for the largest crypto market so far in 2025. According to the latest on-chain data, the Bitcoin network fundamentals have been dwindling since the final quarter of last year. Bitcoin’s Active Addresses And Transaction Count On A Decline? In a Quicktake post on the CryptoQuant platform, a crypto analyst with the pseudonym Yonsei_dent explained how recent price stagnation is tied to declining network activity. One of the relevant on-chain indicators here is the Active Addresses (AA) metric, which measures the number of wallet addresses involved in a transaction within a specific period. Related Reading: $1,000 Solana? Analyst Says Its Written, Predicts When Breakout Will Happen Usually, the Active Addresses metric is used to evaluate investor sentiment on a particular blockchain. According to Yonsei_dent, the number of active addresses on the Bitcoin network is steadily declining, suggesting a “potential weakness in investor participation.” Additionally, a “death cross” recently formed between the AA’s 30-day moving average (30DMA) and its 365-day moving average (365DMA). For context, a “death cross” in technical analysis refers to a bearish signal marked by a short-term moving average crossing below a longer-term moving average. This death cross signals a bearish momentum is forming and that a prolonged downward trend (for both price and network activity) might be on the horizon. Yonsei_dent added: While the two metrics have been fluctuating in a tight range, the 365DMA remains in a downward trend, suggesting a prolonged slowdown in network engagement. Furthermore, another on-chain metric spotlighted by the Quicktake analyst is Transaction Count, which measures the number of unique transactions on the network within a specific period. According to data from CryptoQuant, the number of unique transactions on the Bitcoin network has been declining since Q4 2024. Yonsei_dent associated this worrying trend with the global macroeconomic uncertainty and increasing risk aversion that has plagued the market since US President Donald Trump took the Oval Office. What Next For BTC Price? As inferred earlier, the declining network activity does not exactly bode well for the Bitcoin price action. Periods of low transaction activity have often coincided with prolonged sideways movement and sometimes price corrections. This trend might explain the price performance of the premier cryptocurrency in 2025. The Bitcoin price has struggled to maintain any serious bullish momentum to push new highs. Related Reading: XRP To 3 Digits? The Signs That Could Confirm It, Basketball Analyst Says As of this writing, the price of Bitcoin sits just above $97,700, reflecting a measly 0.3% increase in the past 24 hours. The coin’s weekly record is not any better, as the market leader has increased by barely 1% in the last seven days. Featured image from iStock, chart from TradingView
Data shows that Bitcoin active addresses have sharply dropped despite the high transaction demand; here’s why this may be happening. Bitcoin Active Addresses Have Seen A Sharp Plunge Recently According to the latest weekly report from Glassnode, the active addresses are around cyclical lows of 566,000. The “active addresses” metric measures the daily number of unique Bitcoin addresses participating in some transaction activity on the blockchain. By “unique,” what’s meant here is that the indicator only checks whether an address has been involved in a transfer at least once. This implies that regardless of how many transactions an address might make, its contribution to the active addresses metric will remain just one unit. This restriction exists because the number of unique addresses can serve as an analog to the number of unique users visiting the blockchain, thus providing an estimate for the daily users on the network. Another indicator that’s made for tracking activity on the Bitcoin blockchain is the “transaction count,” which, as its name already suggests, tells us about the daily total number of transfers taking place on the network. When this metric has a high value, it naturally means that many transactions occur on the blockchain. Such indicator values imply a high demand for using the network currently, but the metric can’t say anything about how the activity is distributed; that’s where the active addresses indicator comes in. Related Reading: Bitcoin Miners Continue To Sell, Bearish Sign? Now, here is a chart that shows the trend in the Bitcoin transaction count (as well as its 30-day and 365-day simple moving averages) over the entire history of the asset: The value of the metric seems to have sharply surged recently | Source: Glassnode's The Week Onchain - Week 20, 2023 As displayed in the above graph, the Bitcoin transaction count has recently seen a rapid rise and has hit a new all-time high of about 682,000 daily transfers. The reason behind this explosion in the transaction count is the emergence of the BRC-20 tokens, fungible tokens created on the BTC blockchain using the Ordinals protocol (a way to inscribe data like text and images directly into the chain). These BRC-20 tokens have started a new memecoin mania, with PEPE being the largest example of such a coin. The insanely fast popularity of these tokens has meant that the demand for transacting on the network is more than ever before. What about the active addresses, though? Is this indicator also seeing a rise? Looks like the metric has plunged recently | Source: Glassnode's The Week Onchain - Week 20, 2023 From the chart, it’s apparent that the active addresses observed a rise at first, but then it plunged to a value of 566,000 addresses per day, around the current cyclical low. Related Reading: Stablecoins Interest Spikes As Traders Look To Exit Market This would mean that while the demand for making transactions is super high right now, the demand isn’t actually coming from a large number of users but a rather small number of them who are constantly making repeat transfers. “This is a curious scenario, whereby many BRC-20 users appear to have re-used their Bitcoin addresses,” explains Glassnode. “Perhaps due to having more familiarity with how account-based chains like Ethereum or Solana operate, and less so with the Bitcoin UTXO system.” BTC Price At the time of writing, Bitcoin is trading around $27,400, down 1% in the last week. BTC has shot up over the last 24 hours | Source: BTCUSD on TradingView Featured image from Kanchanara on Unsplash.com, charts from TradingView.com, Glassnode.com
Shortly after surging above $4,000 on December 6, Ethereum (ETH) has sunk into a state of consolidation showing no significant price action over the last day. With growing speculations over the altcoins next price movement, CryptoQuant analyst Burak Kesmeci has shared a report that suggests a sustained price rally by Ethereum. Related Reading: Ethereum Price Breakout: Charting The Uncertain Part Of ETH To $18,000 US Election Results Drive Ethereum Active Addresses To 417,000 Following the US elections of November 5, Ethereum, alongside a host of other cryptocurrencies, has experienced massive price gains driven primarily by the emergence of pro-crypto candidate Donald Trump as the US President-elect. According to Burak Kesmeci, the results of the US elections removed much uncertainty around the crypto market while encouraging investment as evidenced by price gains of several tokens. Notably, Ethereum, known as the “Father of altcoins”, has recorded a price growth of 70% since November 5 reaching a local peak of $4,077. As with all price rallies, there is continuous speculation on Ethereums ability to maintain its current upward price trajectory. Joining the discourse, Kesmeci has drawn a bullish inference from the assets change in active address. The CryptoQuant analyst highlights that during Ethereums recent price surge, active addresses on its network increased by 36.26% from 306,000 on November 5, to its current value of 417,000. This development indicates that the price increase of Ethereum was based on an equal rise in organic demand and market interest by investors and blockchain users. In conclusion, Burak Kesmeci states the growth in Ethereum active addresses backs the recent price rally as healthy and sustainable. Importantly, it is also a bullish signal that indicates ETH is likely to experience a long-term price surge. Related Reading: Ethereum To Pull A BTC 2021-Like Rally? Analyst Shares Massive Prediction ETH Price Overview According to data from CoinMarketCap, Ethereum trades at $4,006 reflecting a slight loss of 0.54% in the past 24 hours. For long-term investors, the prominent altcoin remains in profit based on gains of 7.36% and 39.31% in the last seven and 30 days, respectively. If ETH breaks upward following its current consolidation, the altcoin will face significant resistance at $4,100. However, moving past this price zone opens a potential pathway to $4,900 which lies around Ethereums all-time high at $4,891. Aside from a rise in Ethereum active addresses, other developments continue to contribute to the heightened bullish sentiments around the second-largest cryptocurrency. This includes an increase in the inflows to the Ethereum spot ETFs, as backed by a cumulative total net inflow of $1.41 billion. In addition, the altseason appears to be kicking off with widespread gains tipped to occur in early 2025. Featured image from Forbes, chart from Tradingview
The Bitcoin price and the bull run appear to be back on the right track after recording its best weekly performance in the past month. Despite starting the week quietly and hovering around the $63,000 level, the premier cryptocurrency received fresh bullish momentum mid-week, pushing its value to almost $69,000 on Friday. The latest on-chain observation has revealed that the activity level of the Bitcoin network has been on the rise over the past few weeks. While this development might have contributed to the recent price surge, the question is how far can it push the value of the flagship cryptocurrency? Golden Cross Could Push Bitcoin Price Past $73,737 In a recent Quicktake post on the CrypoQuant platform, an analyst with the pseudonym Yonsei_dent revealed that Bitcoin price might be forming an upward structure. This bullish prognosis is based on the growth rate of active addresses, which represents the number of unique addresses showing significant activity on the Bitcoin network. Related Reading: Bitcoin ETFs See $1.6B Inflows This Week Is BTC Reaching A New ATH Soon? An increase in the number of these active addresses offers insight into the network activity, investor behavior or sentiment, and general market trends. Hence, observing the growth momentum of these unique addresses using moving averages (MAs) of various timelines can be quite useful in assessing current price trends. In their latest analysis, the CryptoQuant analyst utilized a 30-day moving average (30DMA) and a 365-day moving average (365DMA) to capture the growth momentum of the Bitcoin active addresses. As shown in the chart below, the 30-day moving average has witnessed a sharp spike over the past month and appears to be approaching the 365DMA. According to Yonsei_dent, the Bitcoin price could experience a positive shift in bullish momentum if the 30DMA eventually reaches the 365DMA and crosses it to the upside (making a golden cross.) In crypto terms, a golden cross refers to a bullish chart that is characterized by a relatively short-term moving average crossing above a long-term moving average. Typically, a golden cross indicates the potential of a long-term bull market starting or resuming. Ultimately, this indicates that the price of Bitcoin could be readying for a charge towards its all-time high of $73,737. ‘Bitcoin Is Establishing An Upward Structure’ Heres How As of this writing, the Bitcoin price is about 7% adrift of its record-high level. According to data from CoinGecko, the premier cryptocurrency is valued at $68,540, reflecting an over 2% increase in the past day. According to Yonsei_dent, the price of Bitcoin has been forming progressively increasing highs and lows since July, suggesting an upward market structure. Related Reading: BTC Held On Exchanges Hits Lowest Point In 5 Five Years, Heres What It Means For Bitcoin Price However, It is worth noting that these highs and lows appear to be printing a rising wedge pattern, which could be bearish for the Bitcoin price. Featured image created by Dall.E, chart from TradingView
Multiple onchain metrics showed a surge in activity as Bitcoin price rallied to $68,000, possibly signaling that the price momentum is sustainable.
World Crypto Global opens the door to digital freedom for everyone.
Manage your free WCG Coins securely—where simplicity meets global accessibility.
FREE CRYPTO COINS
AVAILABLE FOR RESERVATION
ALREADY ALLOCATED

No fees. No catch. Your crypto journey starts here.